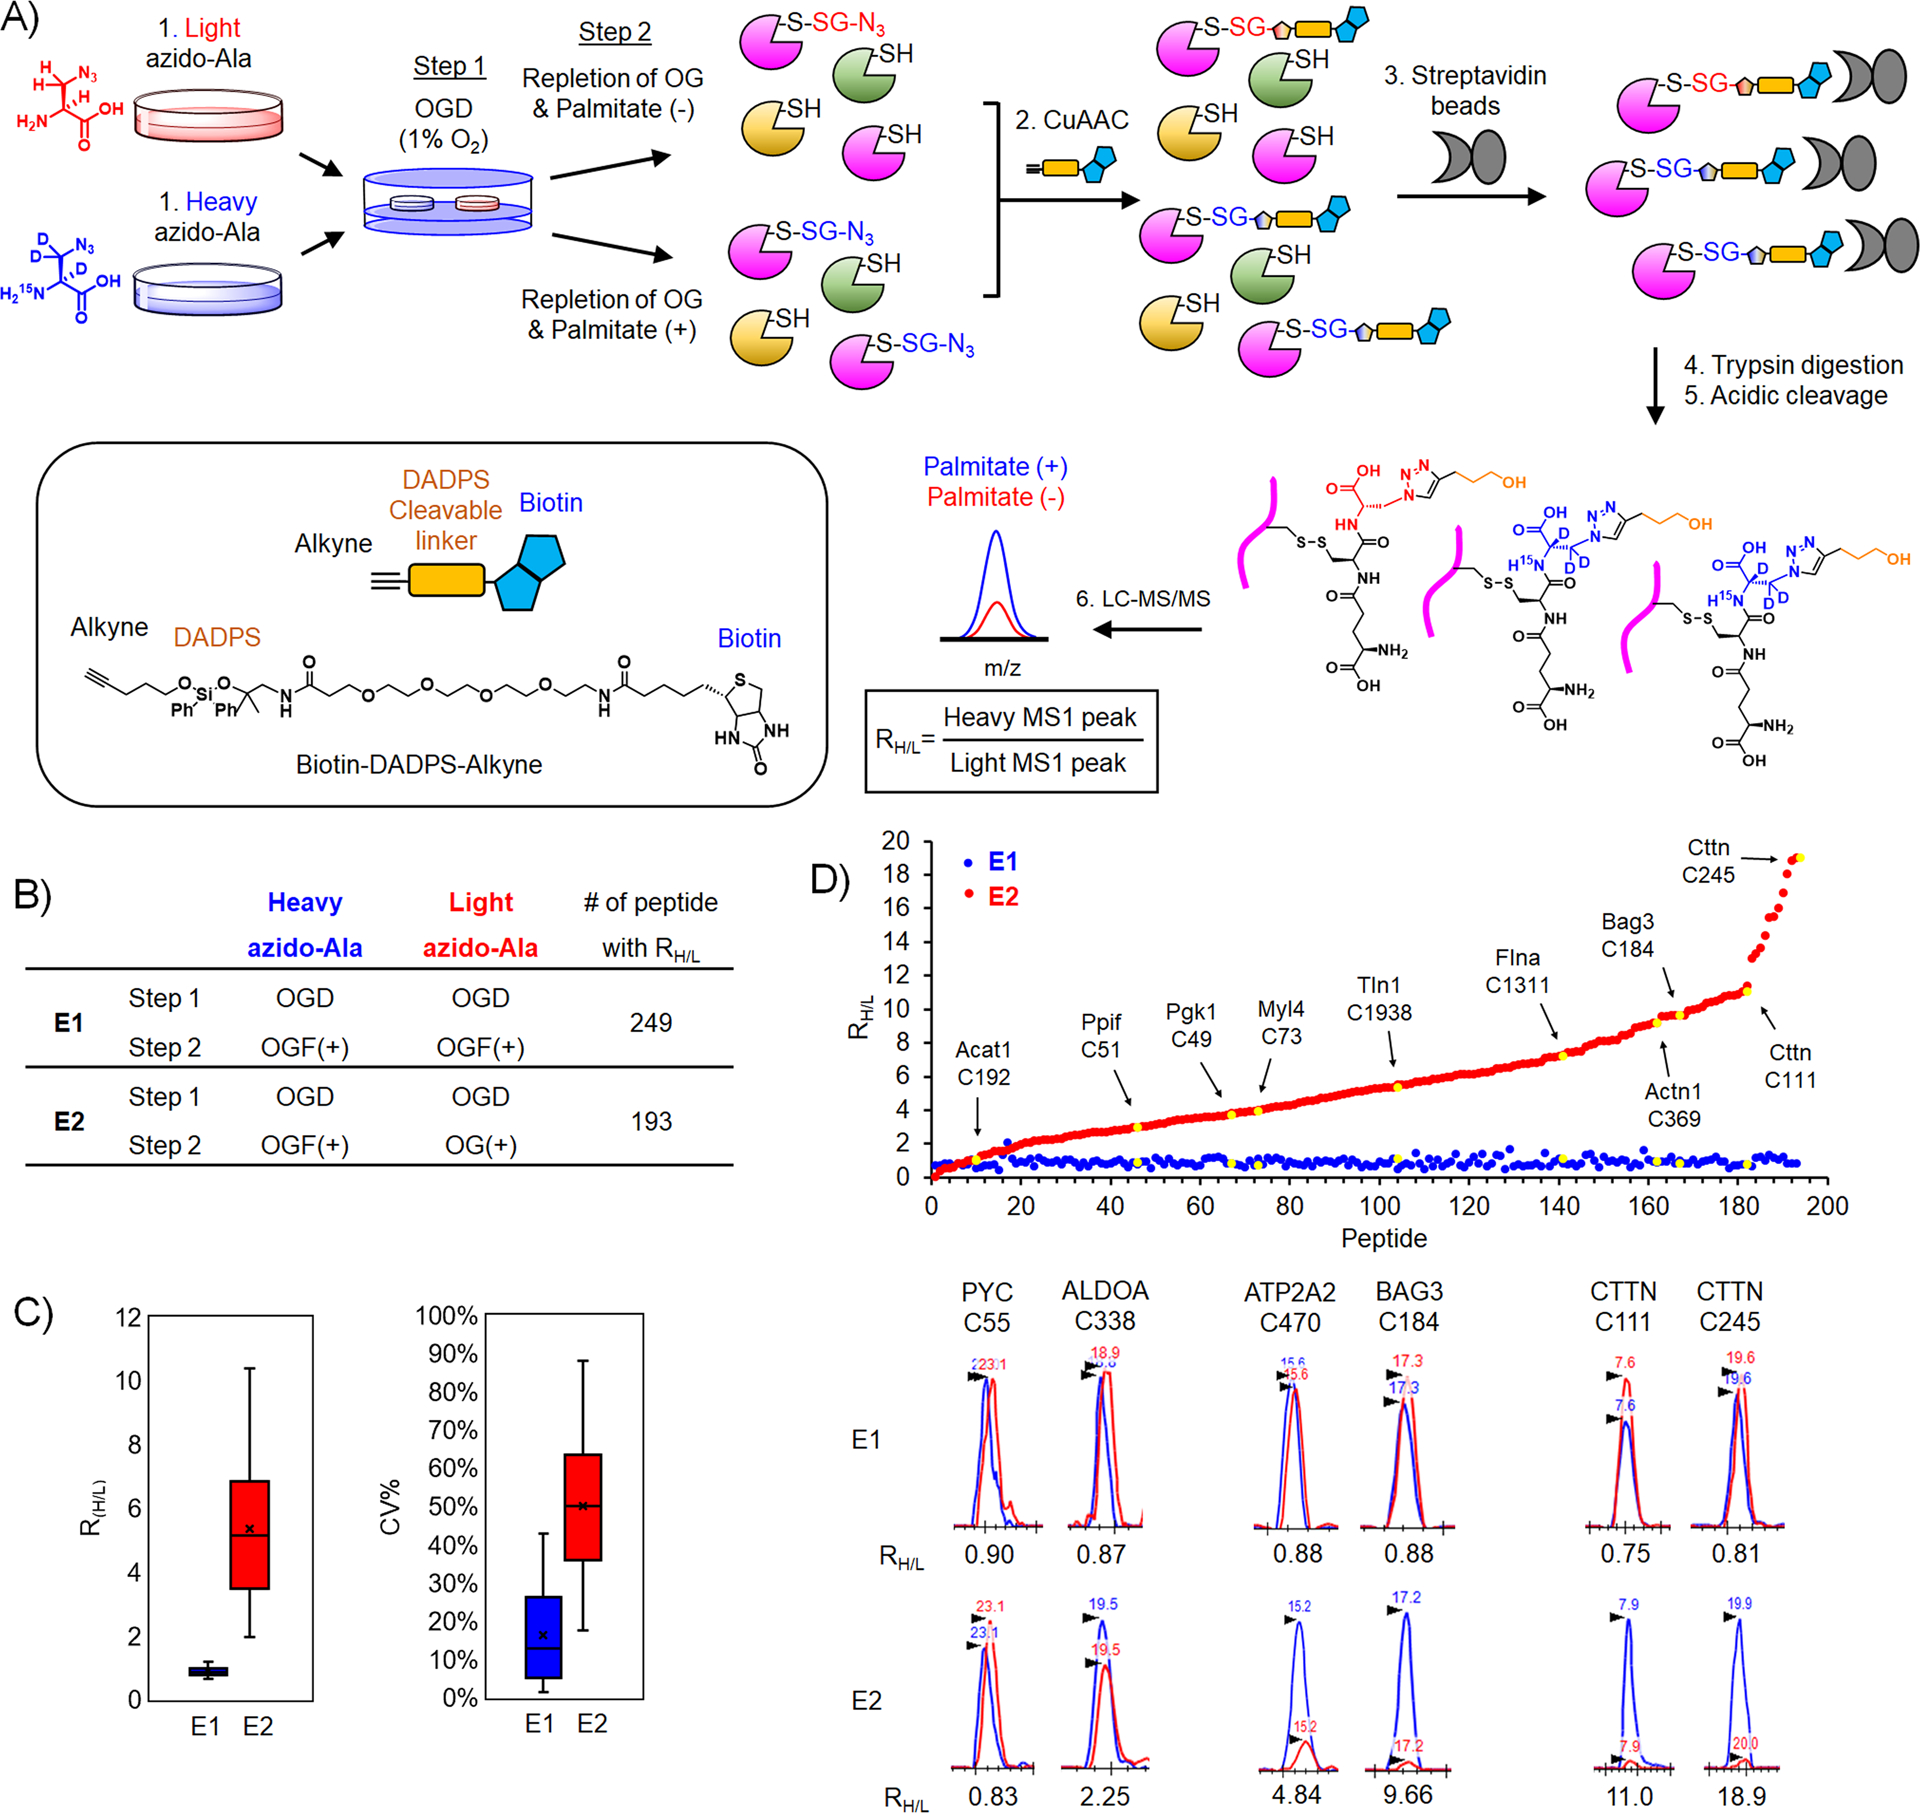
Figure 4. Identification and quantification of glutathionylated cysteines upon addition of palmitate.

(A) Isotopically labeled clickable glutathione approach to identify and quantify levels of glutathionylation. After incubation of light or heavy azido-Ala, two cohorts of HL-1 cells expressing GS M4 were subjected to OGD for 8 h (step 1), followed by repletion of glucose and oxygen (OG) without or with palmitate for 2 h (step 2). Lysates collected were combined and processed for click reactions with biotin-DADPS-alkyne, pull-down with streptavidin beads, on-bead tryptic digestion, and elution of glutathionylated peptides by acidic cleavage of DADPS linker, followed by LC-MS/MS to determine an MS1-peak area ratio (RH/L) of heavy- to light-labeled peptides. (B) Two experimental conditions [E1: OGD, followed by repletion of oxygen, glucose, and palmitate (OGF) for both heavy and light isotopes. E2: OGD, followed by OGF for heavy isotope or repletion of oxygen and glucose only (OG) for light isotope] and the number of quantified glutathionylated peptides. (C) Plots of RH/L values and the coefficient of variation (CV) of glutathionylated peptides. Box plots are shown with the median value (line), box (25–75%), and whiskers (10–90%). (D) RH/L values of individual glutathionylated peptides. Distribution of RH/L values (top). Examples of identified proteins with their cysteine residues are shown by the arrow and yellow color. Graphical display of MS1-peaks showing relative quantification of heavy (blue)- to light (red)-labeled peptides (bottom).
