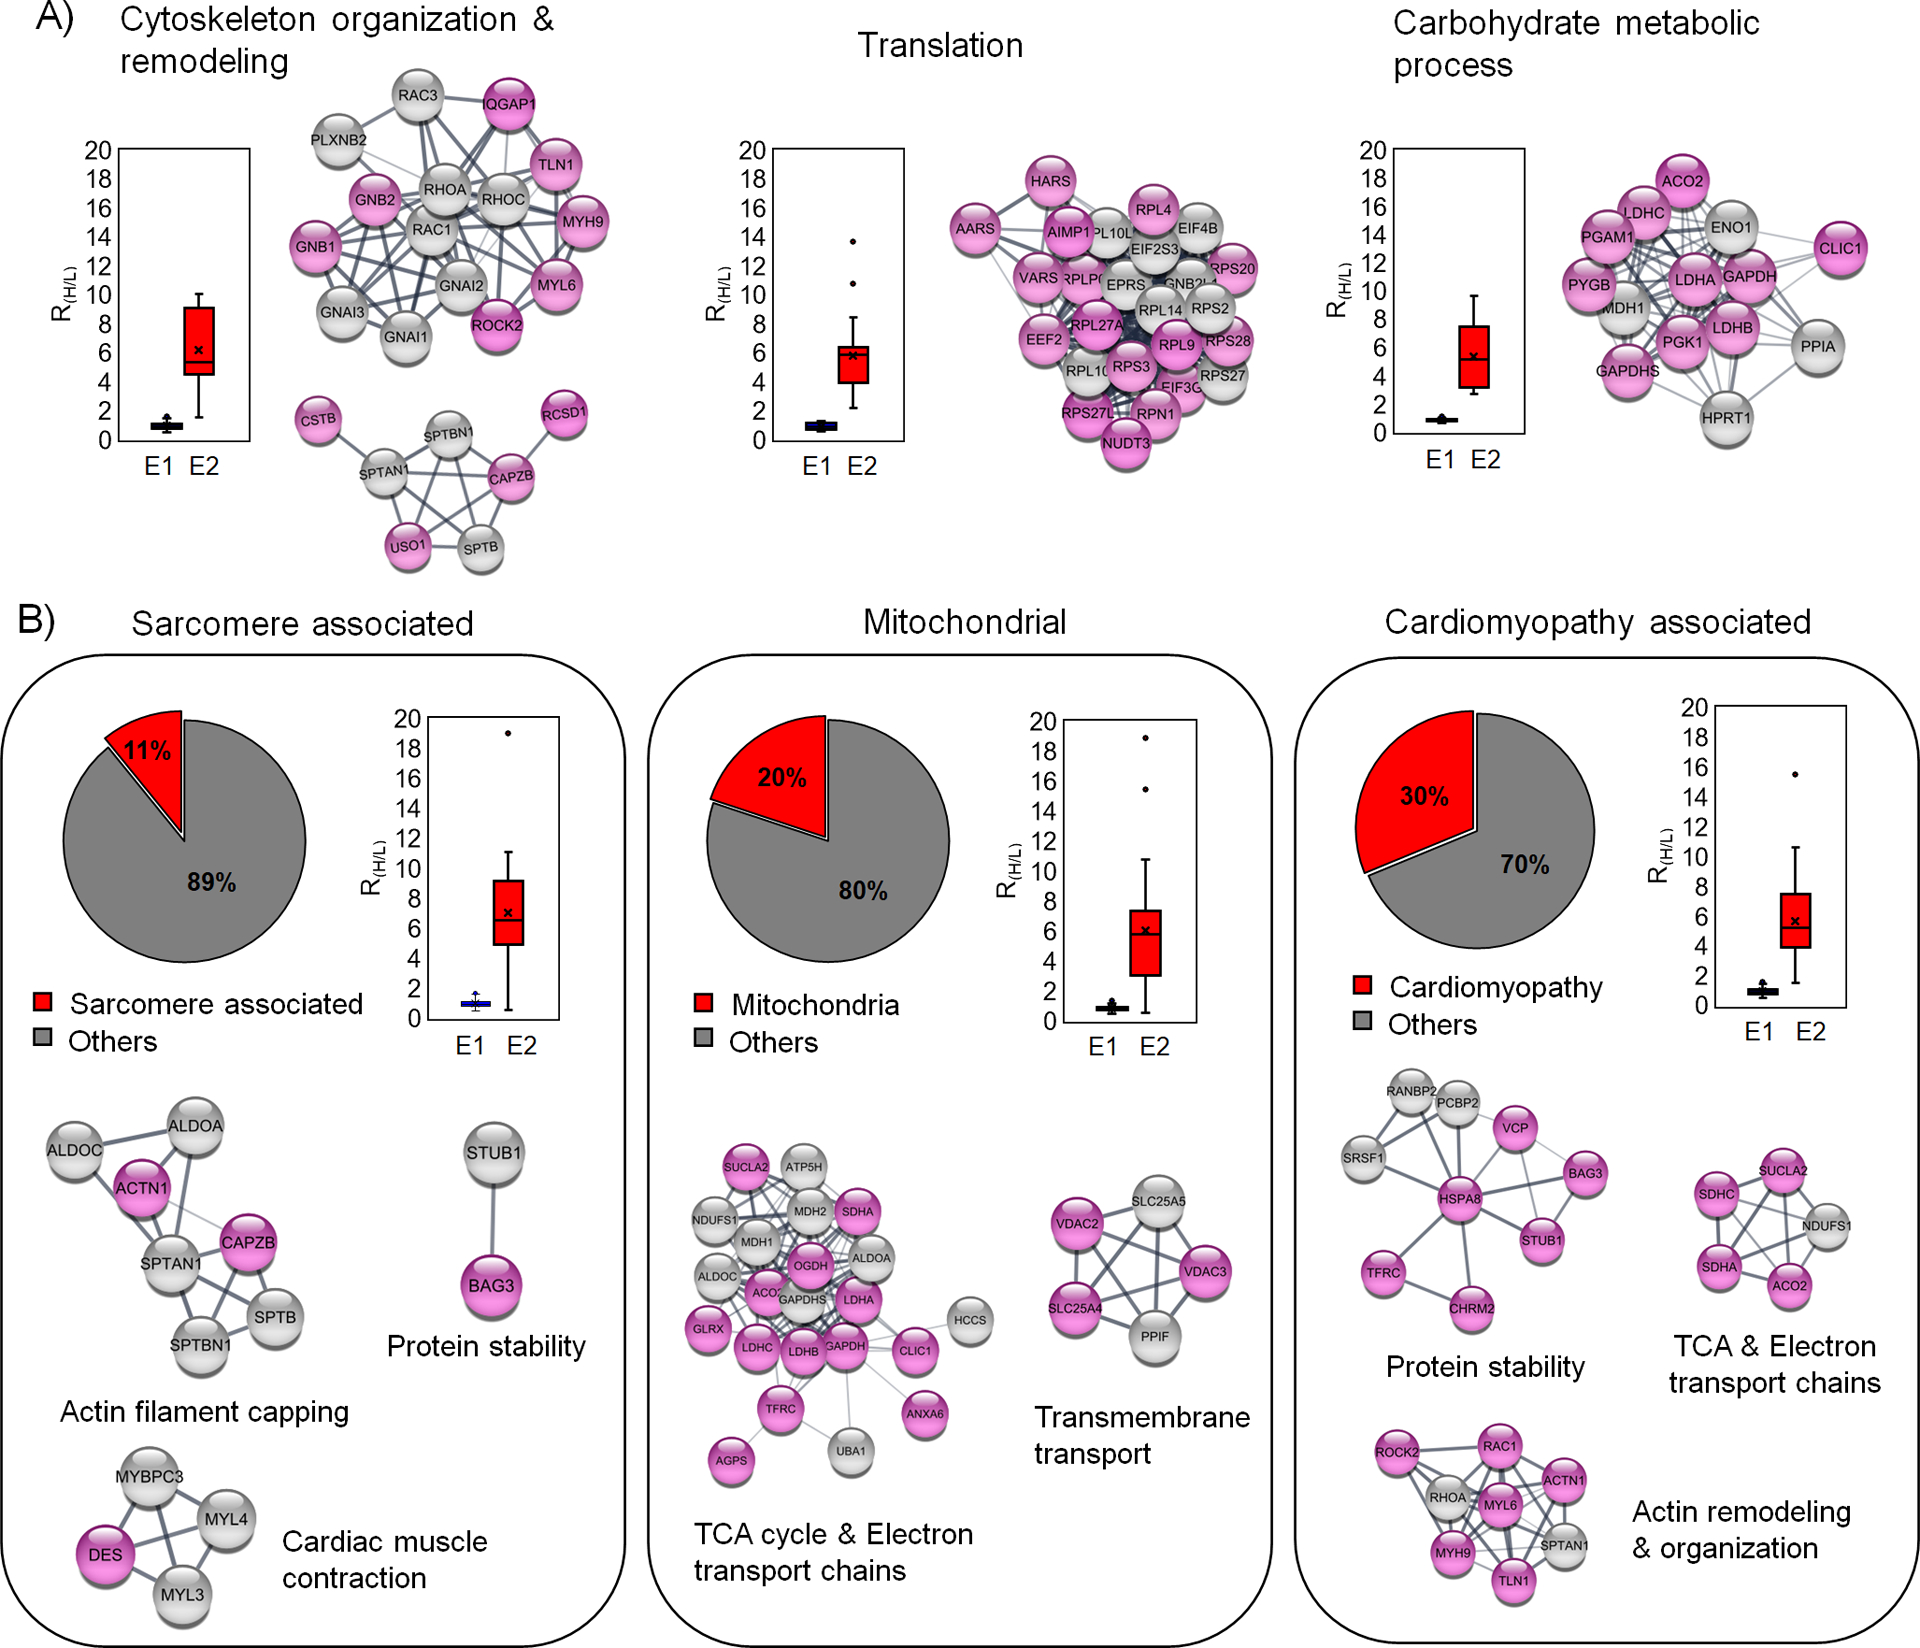
Figure 5. Bioinformatic analysis of glutathionylated proteins upon addition of palmitate.

(A) The major biological process associated with the identified glutathionylated proteins. Each biological process is shown with a plot of RH/L values and selected clusters in STRING analysis. (B) Analysis of glutathionylated proteins in association with sarcomere, mitochondria, and cardiomyopathy. Among identified proteins, sarcomere-associated proteins (left) and mitochondrial proteins (middle) were identified from the DAVID GO database. Glutathionylated proteins associated with cardiomyopathy (right) were identified from cardiomyopathy disease query in STRING analysis. The identified proteins are shown after STRING and cluster analysis with plots of RH/L values. The names of clusters were assigned based on proteins in individual clusters after DAVID GO analysis. Glutathionylated proteins with low RH/L values (below 50% in the group) and high RH/L values [over 50% in the group and NL (no light but heavy label found)] are shown with white and pink colors in circles, respectively.
