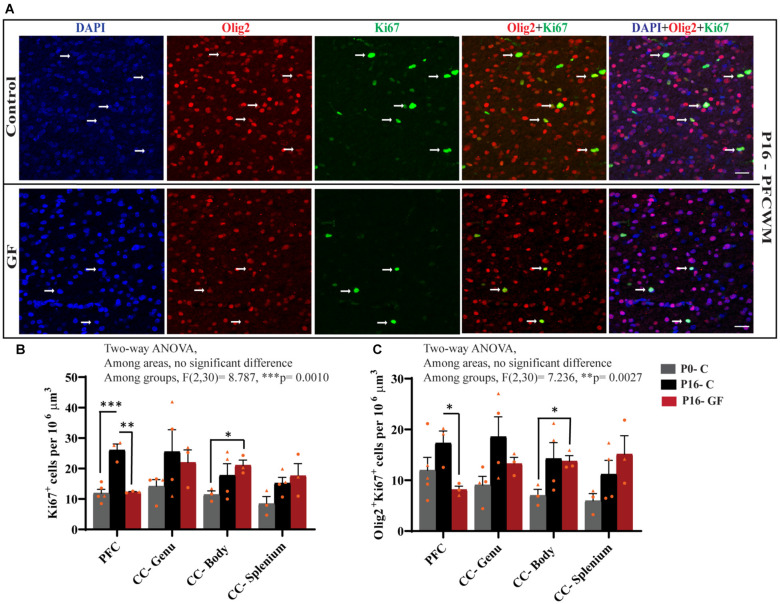
Figure 6.
Region-specific reduction oligodendrocyte proliferation in germ-free piglets at P16. (A) Representative confocal images showing all cells (DAPI+, blue), OLs (Olig2+, red), proliferating cells (Ki67+, green), and proliferating OLs (Olig2+Ki67+, yellow) and merged images in P16 control and germ-free (GF) animals. Scale bars, 50 μm. Quantification of the number of Ki67+ cells (B) and Olig2+Ki67+ proliferating OLs (C). Individual male animals are marked by yellow triangles and female animals are marked by yellow circles. Data expressed as mean ± SEM, n = 3–5 animals/group. **p < 0.0001, two-way ANOVA; *p < 0.05, **p < 0.01, ***p < 0.001, unpaired student’s t-test.

