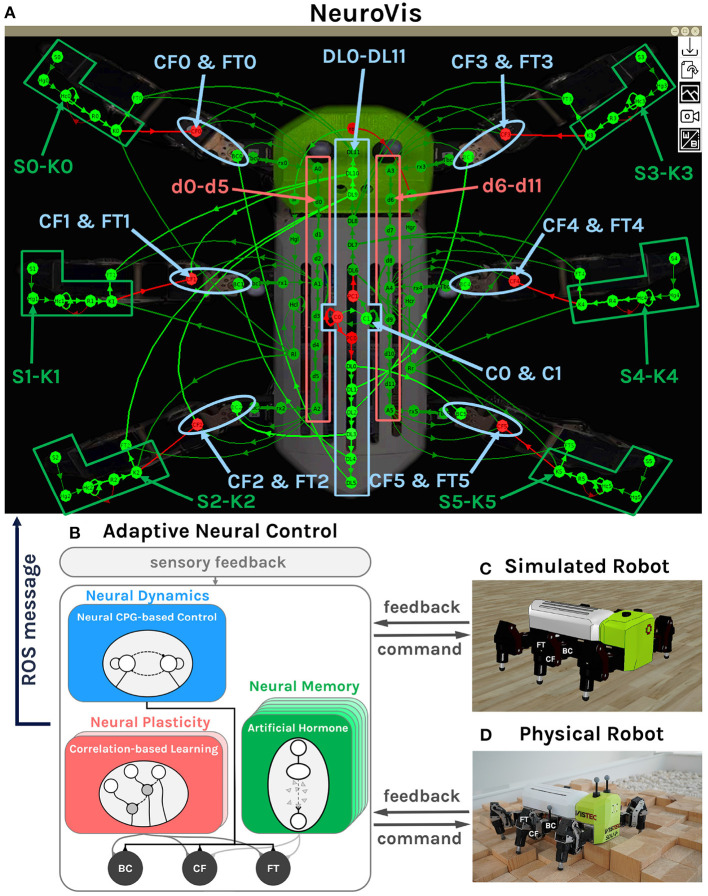
Figure 10.
Neural visualization from NeuroVis showing the overview of the NS of the adaptive neural control network (A). This neural visualization is created based on information published through ROS messages from the adaptive neural control. The ND is presented by the neurons C0, C1, DL0-DL11, CF0-CF5, and FT0-FT5 which are highlighted in blue. The NP is presented by the neurons d0-d11, which are highlighted in red. The NM is represented by the neurons S0-K0 to S5-K5, which are highlighted in green. (B) The diagram of the adaptive neural control with the highlighted neural components that are employed to present the ND, NP, and NM. (C) Simulated robot. (D) Physical robot (Thor and Manoonpong, 2019). A video of this use case can be seen at Supplementary Video 46.

