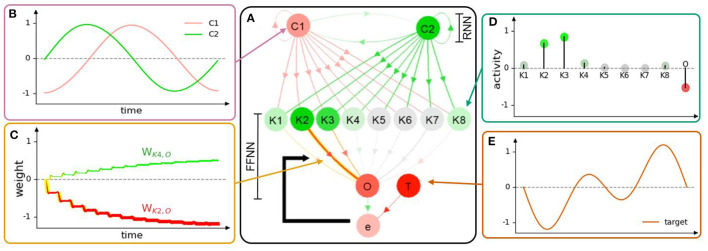
Figure 4.
(A) Neural visualization of the network in the first use case. (B) C1 and C2 activities or outputs of the RNN. (C) Connection weights of K2 and K4 to O, where the change of line thickness and luminous intensity (yellow) represents the weight changes (NP). Red and green colors indicate the propagated signals that contribute to the decrease and increase of activity, respectively. (D) The activities of K1-8 and O are mapped according to the color of the gradient. The saturated green node, saturated red node, and color-less node indicate highly positive, highly negative, and inactive (≈0) neural activities, respectively. (E) The target function at neuron T of the first use case. Note that the graphs (B–D) illustrate the neural information analysis based on the visualization of NeuroVis. In this study, for simplicity, only the weights between K1-8 and O are adapted online to observe the NP and NM. A video of this use case can be seen at Supplementary Video 13.

