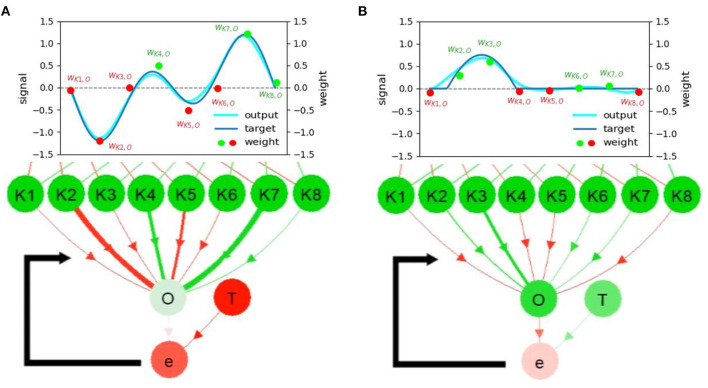
Figure 7.
Snapshots of the networks trained with (A) the first and (B) the second target functions. Snapshots are from Supplementary Video 13 after the training end. The relationship between the converged weights, output, target, and neural visualization is depicted. Scatter plots and their color represent the weight magnitude and the sign of information transmitted through the connections, respectively. Note that wi,j denotes the connection weight from neuron i to neuron j. A video of this use case can be seen at Supplementary Video 11.

