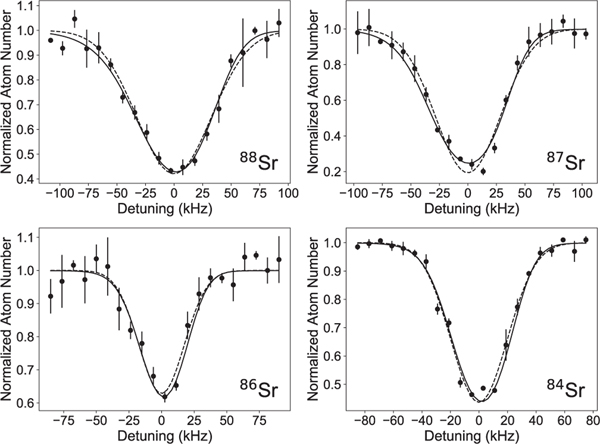
FIG. 3.
Line-shape curves for the 698-nm clock transition. The curves include a Gaussian model (dashed line) and a full line-shape model (solid line) fit to the averaged data points (circle points). In both cases, the fit error on the centroid is roughly 1 kHz; however, the full line-shape model fits a different ω0 which varies as a function of temperature and has a lower frequency compared to the Gaussian line center by up to 20 kHz. This is attributable to the thermal distribution of atoms in a dipole trap with inhomogeneous AC Stark shifts.

