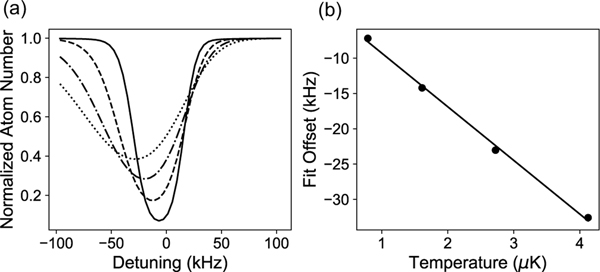
FIG. 4.
Effects of thermal line shift on the clock transition. (a) Line-shape simulations as a function of temperature with 0.79 μK (solid line), 1.6 μK (dashed line), 2.7 μK (dash-dotted line), and 4.1 μK (dotted line). (b) Systematic offset to the Gaussian fitted center as a function of temperature and a linear fit to the data extracted from the simulation in (a).

