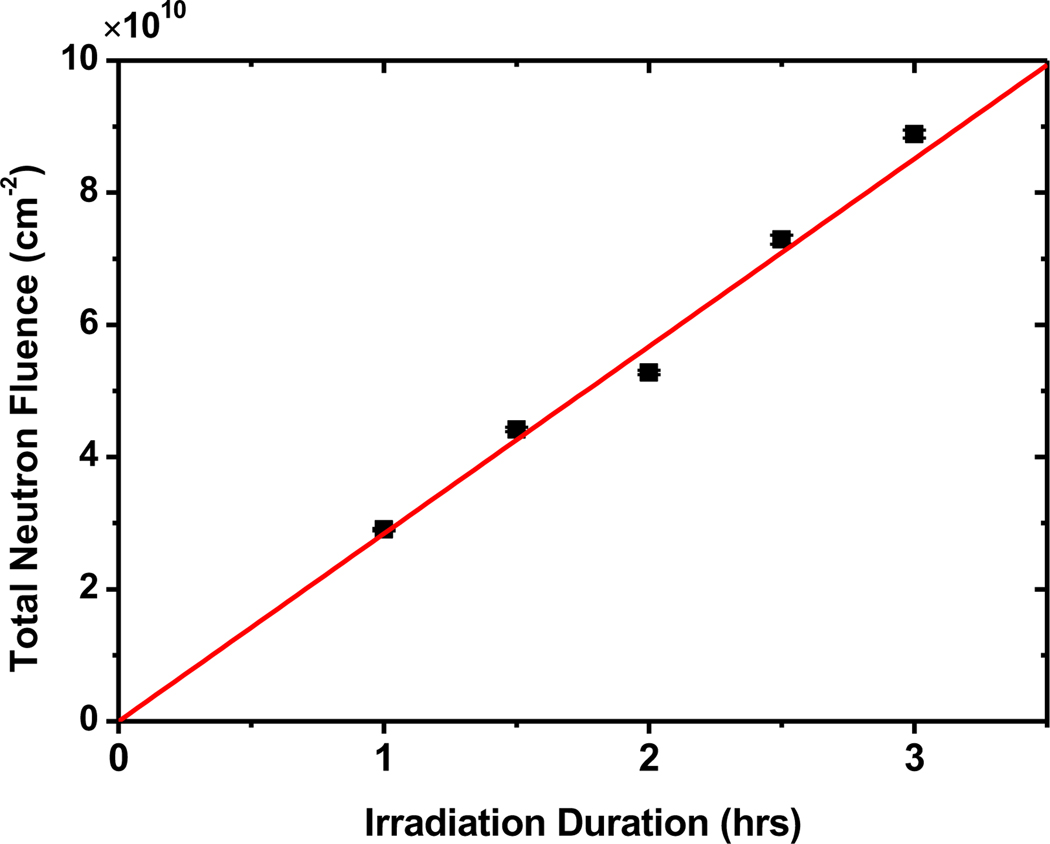
Fig. 5.
Calibration of the neutron fluence versus time of irradiation. Graph shows the calculated total neutrons incident upon the cell versus irradiation time. The average neutron flux density is (7.73±0.59) × 106 cm−2 sec−1 from the slope. Statistical uncertainties are similar to the size of the plot symbols.

