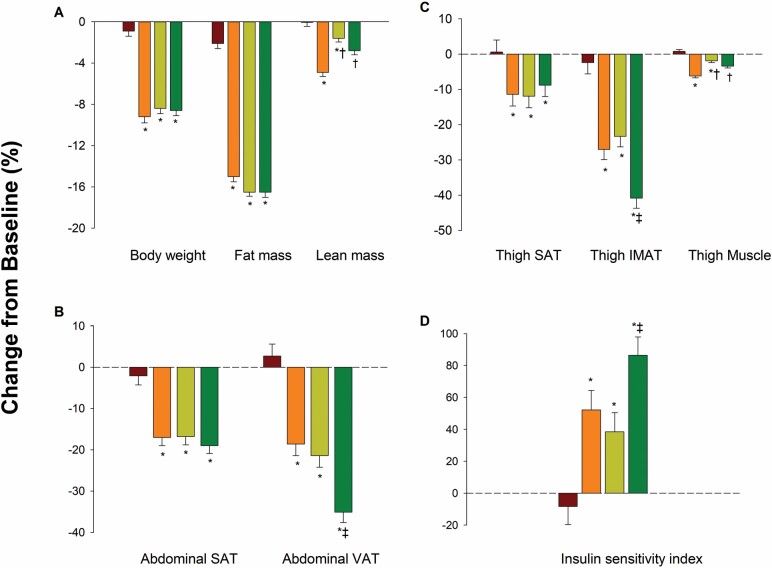
Figure 1.
Mean percentage changes in body weight and composition (A), abdominal subcutaneous adipose tissue (SAT) and visceral adipose tissue (VAT) volumes (B), thigh SAT, thigh intermuscular adipose tissue (IMAT), and thigh muscle volumes (C), and insulin sensitivity index (D) in the control (red bars), aerobic (orange bars), resistance (olive green bars), and combination (darker green bars) groups. Percentage changes are presented as least-squares adjusted means; T bars indicate standard errors. The asterisk indicates p < .05 for the comparison with the control group, the dagger p < .05 for the comparison with the aerobic group, and the double dagger p < .05 for the comparison with the resistance group. Error bars represent the least-squares adjusted SE from repeated-measures analysis of variance.

