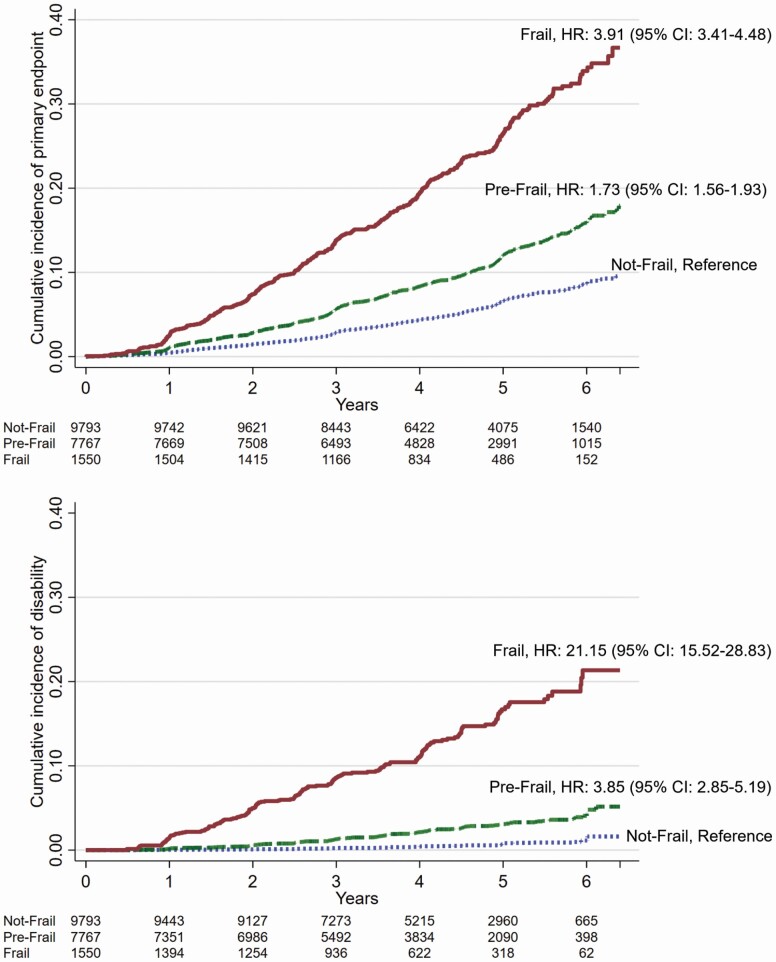
Figure 3.
Cumulative incidence of primary composite outcome (death, dementia, or persistent physical disability, upper graph) and persistent disability (lower graph) according to frailty status at baseline based on frailty index score (prefrail > .10 and ≤ .21; frail > .21). The hazard ratio (HR) and 95% confidence interval (CI) are adjusted for age, gender, and ethno-racial group, and in all cases, p < .001.

