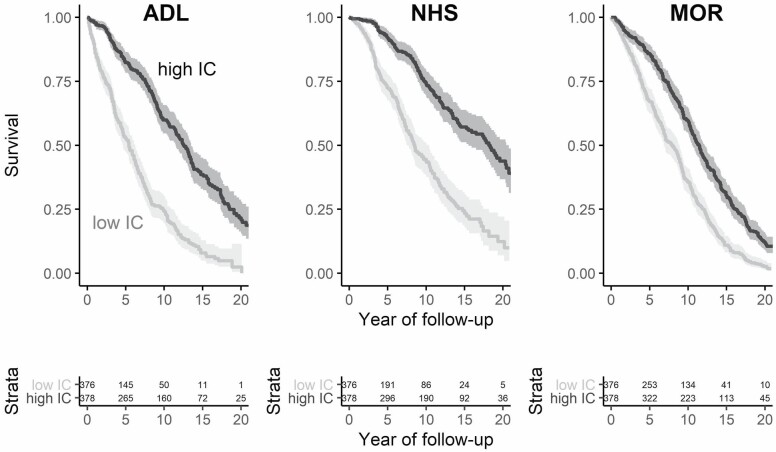
Figure 2.
Baseline intrinsic capacity (IC) and negative health outcomes. Kaplan–Meier plots for survival probability (ie, the probability to not experience the respective health outcome) by IC category (high = above-median IC, low = below-median IC) at baseline. Shaded areas indicate 95% confidence intervals. Below, the absolute number of participants at risk by a group is shown. ADL = incidence of disability in activities of daily living; NHS = nursing home stay; MOR = mortality.

