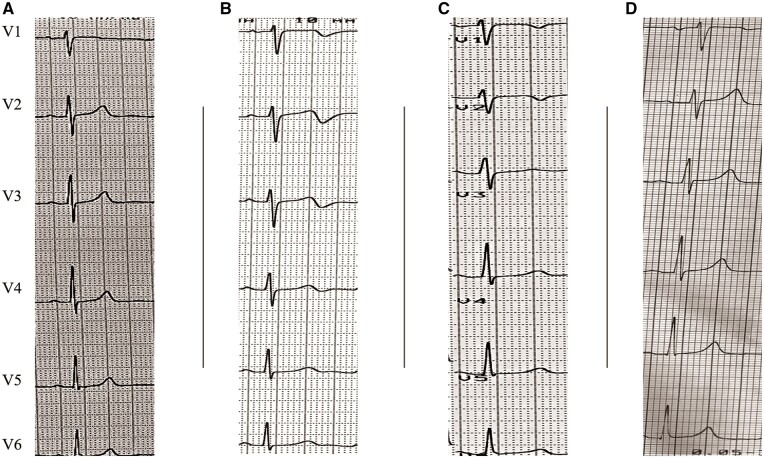
Figure 1.
Precordial leads of pre- and post-ablation electrocardiograms showing the dynamics of electrocardiogram changes in V1–V4 leads. (A) Pre-ablation electrocardiogram with biphasic T wave in I lead and positive T waves in V2–V4 leads; (B) electrocardiogram on 2nd post-ablation day at the time of chest pain presentation revealed biphasic T waves in V1–V4; (C) electrocardiogram on the 7th post-ablation day shows regression of T wave changes; (D) electrocardiogram during 6 months of follow-up revealed complete regression of T wave changes.

