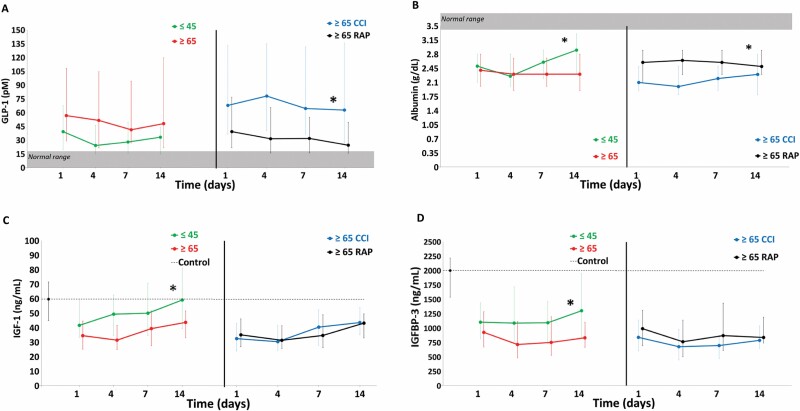
Figure 3.
Comparison of stress and catabolism biomarkers between older and young sepsis patients. Stress metabolism: (A) glucagon-like peptide 1 (GLP-1) and (B) serum albumin level. Anabolism: (C) insulin-like growth factor (IGF-1) and (D) insulin-like growth factor-binding protein 3 (IGFBP-3) biomarkers. Perforated line represents biomarker levels in matched control subjects. Shaded area represents published normal reference ranges. Data presented as median (25% and 75%) with statistical significance set at p <.05 and asterisk represents statistical significance of the older (vs young) and older chronic critical illness (CCI) (vs older rapidly recover [RAP]) cohorts.

