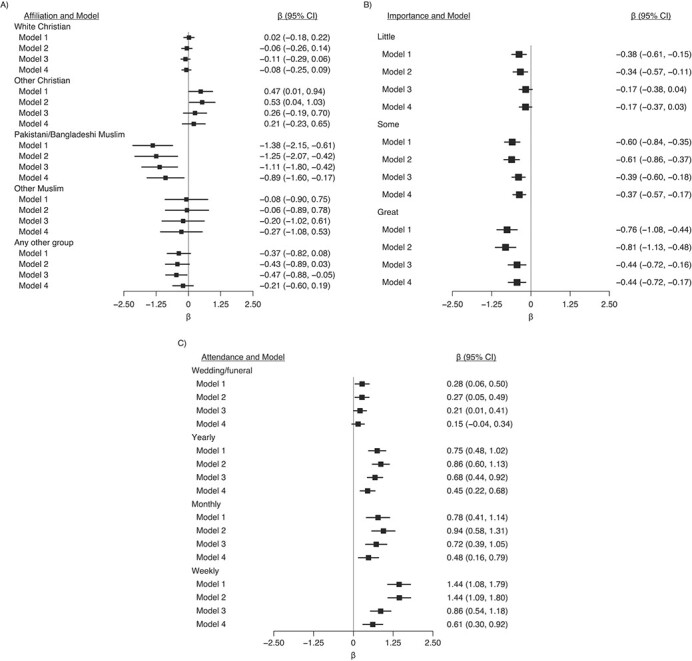
Figure 3.

Associations between religiosity measures in wave 1 (2009–2011) and General Health Questionnaire (GHQ) score in wave 4 (2012–2014), Understanding Society: the UK Household Longitudinal Study, United Kingdom. A) Religious affiliation (reference category is nonreligious); B) importance of religion (reference category is none); and C) religious attendance (reference category is never). The total number was 50,922 (72 observations from the original sample of 50,994 were dropped due to the sampling design because 6 strata contained no population members). Model 1 was adjusted only for religion variables; model 2 was additionally adjusted for age, sex, and country of birth; model 3 was additionally adjusted for outcome and clinical depression at baseline (wave 1); and model 4 was additionally adjusted for all other covariates. Full information maximum likelihood estimation was used to account for missing exposure and confounder data. GHQ scores were reverse coded so that higher scores equated to more favorable wellbeing. CI, confidence interval.
