
Figure 4. Renal outcomes.
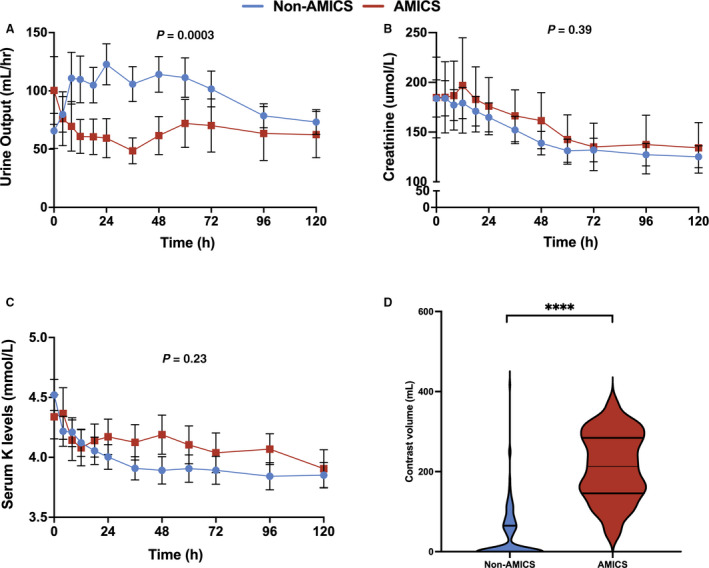
A, Changes in urine output (mL/h) from baseline to 120 hours (P=0.0003). B, Changes in creatinine (µmol/L) from baseline to 120 hours (P=0.39). C, Changes in serum potassium levels (mmol/L) from baseline to 120 hours (P=0.23). D, Contrast volume was elevated in acute myocardial infarction complicated by cardiogenic shock (213.0 [147.0–279.0] mL vs 0.0 [0.0–65.0] mL; P<0.0001). A repeated measure mixed model was used to evaluate differences in the continuous variables between the 2 groups. All panels reveal mean±95% CIs with blue representing nonacute myocardial infarction complicated by cardiogenic shock and red representing patients with acute myocardial infarction complicated by cardiogenic shock. AMICS indicates acute myocardial infarction complicated by cardiogenic shock. **** represents P<0.0001.