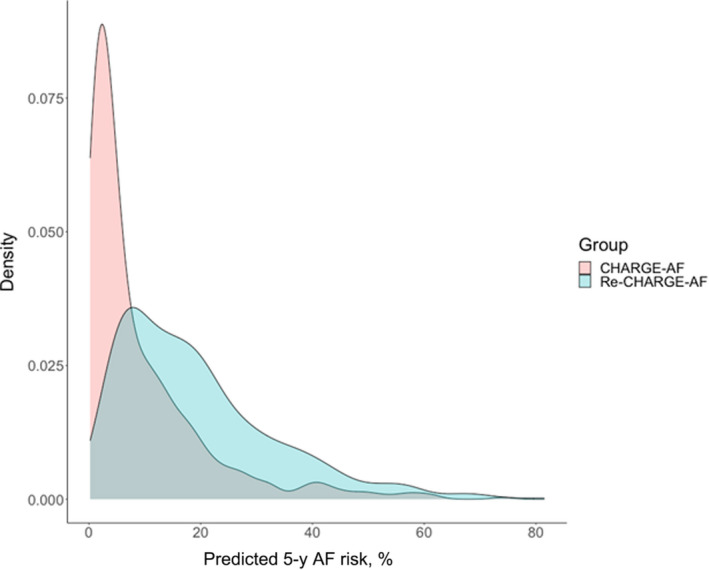
Figure 2. Density plot of the predicted 5‐year probabilities of atrial fibrillation (AF).

The plot depicts the distribution of predicted 5‐year probability from the Cohorts for Heart and Aging Research in Genomic Epidemiology for Atrial Fibrillation (CHARGE‐AF) model (pink) and the fully refitted CHARGE‐AF (Re‐CHARGE‐AF) model (blue). Overlap in the distributions is depicted in gray.
