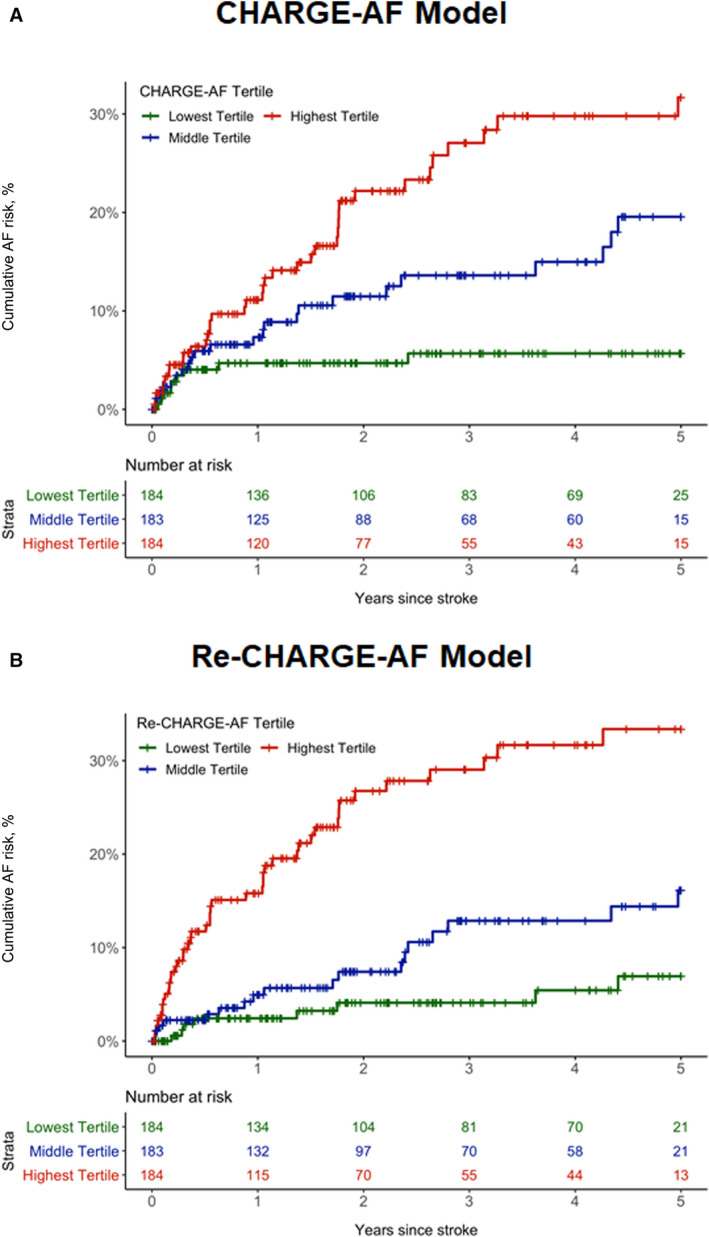
Figure 3. Cumulative risk of atrial fibrillation (AF) stratified by tertile groups of predicted AF risk.

A, Depicts the cumulative risk of AF by tertile groups (green: lowest tertile [0.21%–2.68%]; blue: middle tertile [2.72%–9.21%]; red: highest tertile [9.23%–74.14%]) of predicted AF risk for the Cohorts for Heart and Aging Research in Genomic Epidemiology for Atrial Fibrillation (CHARGE‐AF) model. B, Depicts the cumulative risk of AF by tertile groups (green: lowest tertile [1.09%–10.98%]; blue: middle tertile [11.05%–21.84%]; red: highest tertile [21.93%–81.47%]) of predicted AF risk for the fully refitted CHARGE‐AF (Re‐CHARGE‐AF) model.
