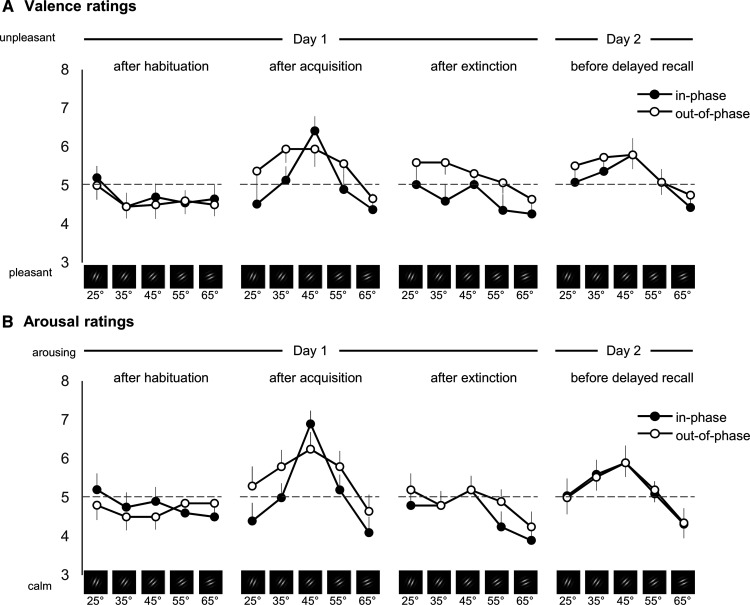
Figure 6.
A, B, Valence ratings (A) and arousal ratings (B) separated for each measurement point: after habituation, after acquisition, after extinction (day 1), and before delayed recall (day 2). Valence was rated with the Self-Assessment Manikin on a 9-point scale from 1 (unpleasant) to 9 (pleasant). For better comparability with arousal ratings, valence ratings were recoded, changing the scale from 1 (pleasant) to 9 (unpleasant). Arousal was also rated with the Self-Assessment Manikin, here ranging from 1 (calm) to 9 (arousing). Each data point presents valence or arousal ratings, respectively, for each CS orientation (averaged over participants per group and measurement point), error bars show 1 SEM. Note: for better visualization, the y-axis is scaled from 3 to 8 instead of showing the full range from 1 to 9. Extended Data Figure 6-1 shows discrimination indices (CS+ minus the weighted average of all CS–) and estimation statistics of valence and arousal data. Extended Data Figure 6-2 additionally shows the discrimination indices that use the unweighted average of all CS– values for subtraction.

