
Figure 6. The Forest plot of multivariate Cox proportional hazard regression model for prognostic evaluation.
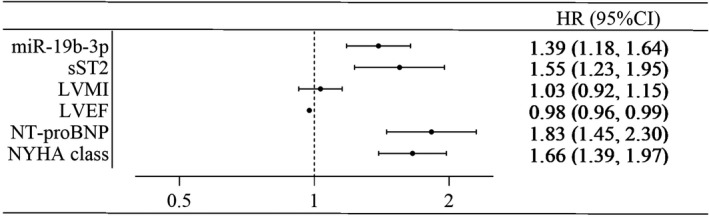
The level of miR‐19b‐3p, sST2, and NT‐proBNP was analyzed after logarithmic transformation.
Official websites use .gov
A
.gov website belongs to an official
government organization in the United States.
Secure .gov websites use HTTPS
A lock (
) or https:// means you've safely
connected to the .gov website. Share sensitive
information only on official, secure websites.
The level of miR‐19b‐3p, sST2, and NT‐proBNP was analyzed after logarithmic transformation.