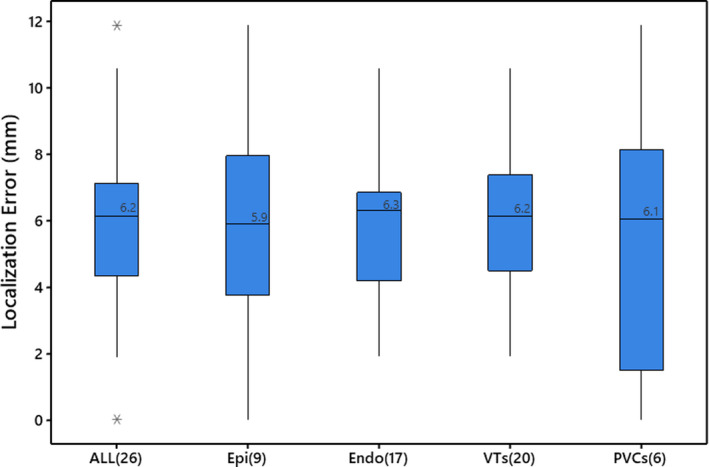
Figure 2. Box plot of localization errors between clinically identified ventricular tachycardia exit/premature ventricular contraction origin sites and sites estimated by the automatic arrhythmia‐origin localization system in the prospective case series study.

Boxes represent interquartile ranges; error bars represent the ranges for the bottom 25% and the top 25% of the data values, excluding outliers; “*” indicates outliers located outside the whiskers of the box plot; line and value in the box indicate the median value. The ALL plot represents the aggregate of all ventricular tachycardias and premature ventricular contractions. Endo indicates endocardial ventricular tachycardias and premature ventricular contractions; Epi, epicardial ventricular tachycardias and premature ventricular contractions; PVC, premature ventricular contractions; and VT, ventricular tachycardias. Sample sizes are included in parentheses brackets.
