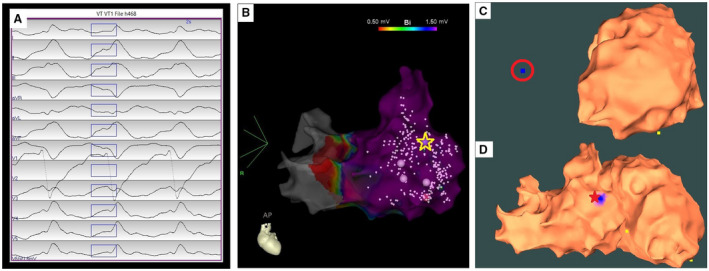
Figure 4. Localization of a ventricular tachycardia (VT) exit site on the right ventricular electroanatomic mapping (EAM) surface by the automatic arrhythmia‐origin localization system.

A, Recorded 12‐lead ECG of an induced VT during the procedure for patient #13. B, Patient‐specific right ventricular EAM with antero‐posterior view, with the VT exit site (identified by pace‐mapping) depicted by the yellow star. C, Usage of the automatic arrhythmia‐origin localization system to predict a VT exit site indicated by the blue dot with a red circle outside of the left ventricular EAM geometry when mapping at the left ventricle. D, The automatic arrhythmia‐origin localization system was used to predict the VT exit site marked in the blue patch onto the mid‐basal anteroseptal wall of right ventricle after including the right ventricular EAM geometry, achieving a localization accuracy of 1.9 mm. The actual VT exit site marked by the red star; yellow dots indicate recorded pacing sites on the EAM.
