
Figure 4. Correlations between the extent of amyloid and fibrosis and high‐sensitivity troponin T (hs‐TnT).
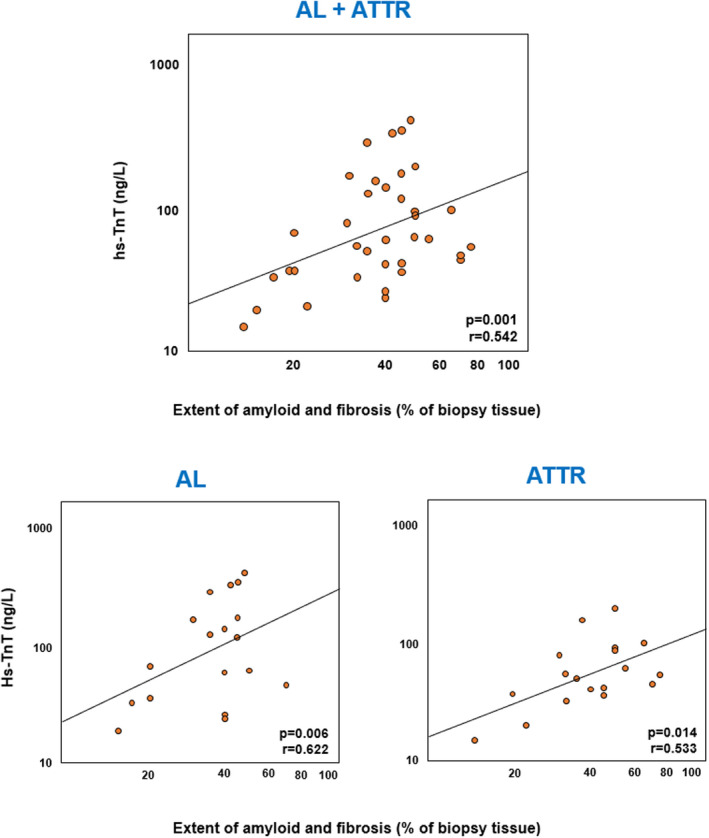
hs‐TnT values are in a log‐scale. AL indicates amyloid light chain amyloidosis; and ATTR, amyloid transthyretin amyloidosis.
Official websites use .gov
A
.gov website belongs to an official
government organization in the United States.
Secure .gov websites use HTTPS
A lock (
) or https:// means you've safely
connected to the .gov website. Share sensitive
information only on official, secure websites.
hs‐TnT values are in a log‐scale. AL indicates amyloid light chain amyloidosis; and ATTR, amyloid transthyretin amyloidosis.