
Figure 3. Effects of ibrutinib on Na+ current (INa) in right atrial (RA) myocytes.
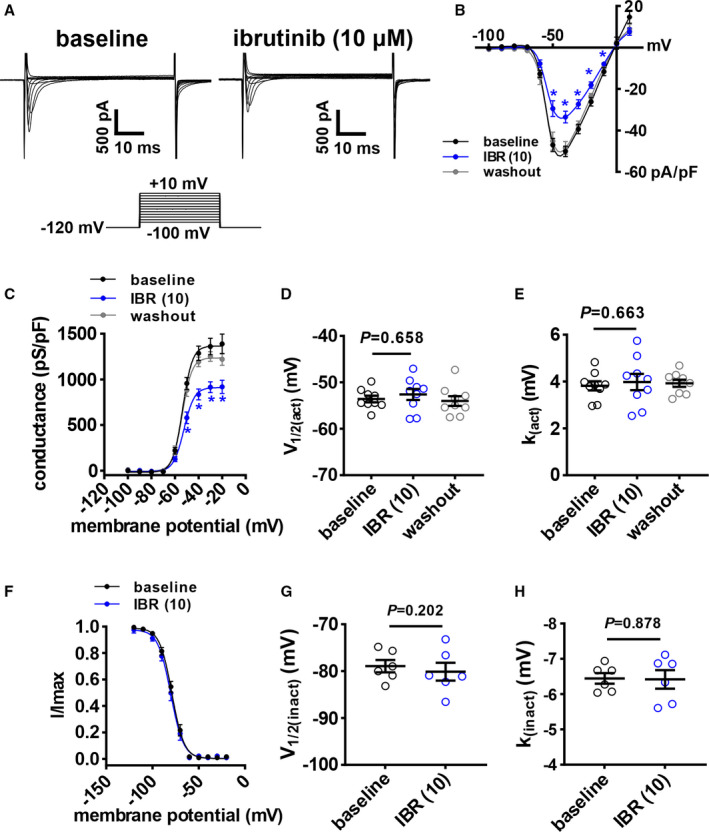
A, Representative RA INa recordings at baseline and after application of 10 µmol/L of ibrutinib (IBR (10)). Voltage clamp protocol shown below recordings. B, RA INa I‐V curves at baseline, after application of IBR (10), and after washout of ibrutinib. C, RA INa activation curves at baseline, after application of IBR (10), and after washout of ibrutinib. D and E, Summary of INa voltage for 50% channel activation (V1/2(act); D) and INa slope factor (k(act); E) at baseline, after application of IBR (10), and after washout of ibrutinib. Panels B and C analyzed by 2‐way repeated measures ANOVA with Tukey post hoc test, data in panels D and E were analyzed by mixed effects analysis with Tukey post hoc test; n=9 RA myocytes from 4 mice. F, RA INa inactivation curves at baseline and after application of IBR (10). G and H, Summary of voltage for INa half‐maximal inactivation (V1/2(inact); G) and INa slope factor (k(inact); H). Data in panel F were analyzed by 2‐way repeated measures ANOVA with Tukey post hoc test; data in panels G and H were analyzed by paired Student t test; n=6 RA myocytes from 3 mice.