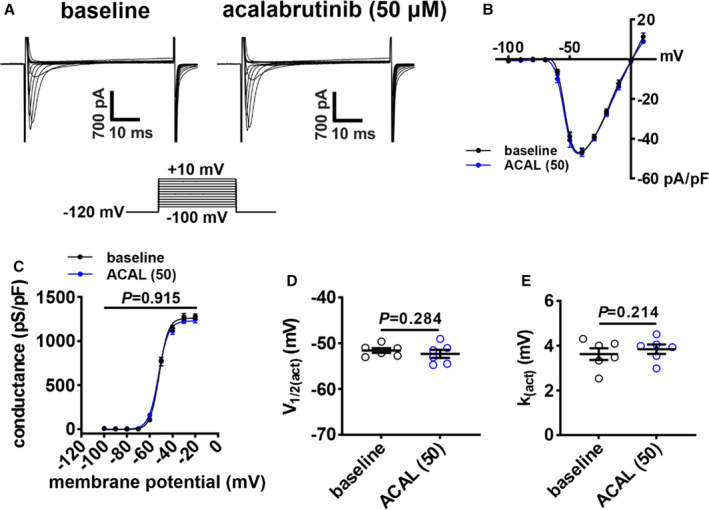
Figure 4. Effects of acalabrutinib on Na+ current (INa) in right atrial (RA) myocytes.

A, Representative RA INa recordings at baseline and after application of 50 µmol/L of acalabrutinib (ACAL (50)). B, RA INa I‐V curves at baseline and after application of ACAL (50). C, RA INa activation curves at baseline and after application of ACAL (50). D and E, Summary of INa voltage for 50% channel activation (V1/2(act); D) and slope factor (k(act); E) at baseline and after application of ACAL (50). Data in panels B and C were analyzed by 2‐way repeated measures ANOVA with a Tukey post hoc text; data in panels D and E were analyzed by paired Student t test; n=6 RA myocytes from 3 mice.
