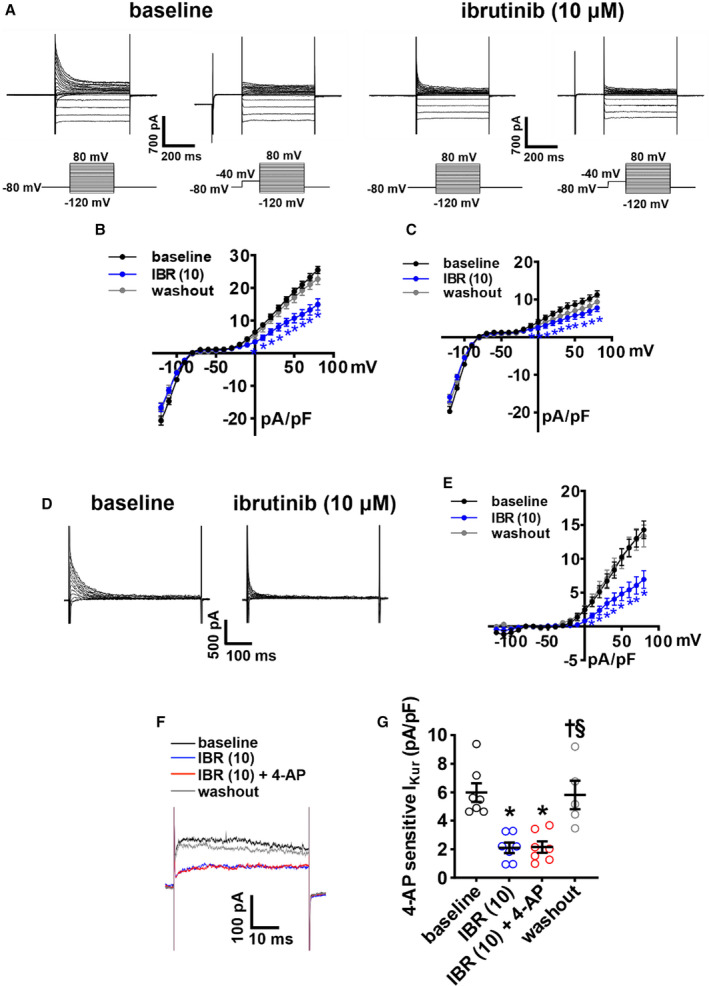
Figure 5. Effects of ibrutinib on repolarizing K+ currents in right atrial (RA) myocytes.

A, Representative RA total K+ current (IK(tot)) recordings, with and without a prepulse (−40 mV) to inactivate transient outward K+ current (Ito), at baseline and after application of 10 µmol/L of ibrutinib (IBR (10)). Voltage clamp protocols shown below recordings. B–C, Summary IK(tot) I‐V curves measured at the peak of the recordings without the prepulse (B) and with the prepulse (C) at baseline, after application of IBR (10) and after washout of IBR. D, Representative Ito recordings at baseline and after application of IBR (10) generated by digital subtraction of peak IK(tot) with and without a prepulse as shown in panel A. E, Ito I‐V curves at baseline, after application of IBR (10), and after washout of IBR. Ito was measured as the difference current between IK(tot) recordings with and without the prepulse. For panels B–E: *P<0.05 vs baseline by mixed effects analysis with Tukey post hoc test; n=8 RA myocytes from 3 mice. F, Representative RA IK(tot) recordings at +30 mV illustrating the effects of IBR (10) and 4‐aminopyridine (4‐AP; 100 µmol/L, inhibits Kv1.5) on IK(tot). G, Summary data illustrating the effects of IBR (10) and 4‐AP on IK(tot). *P<0.05 vs baseline, † P<0.05 vs IBR (10), § P<0.05 vs IBR (10) + 4‐AP by mixed effects analysis with a Tukey post hoc test; n=7 RA myocytes from 3 mice.
