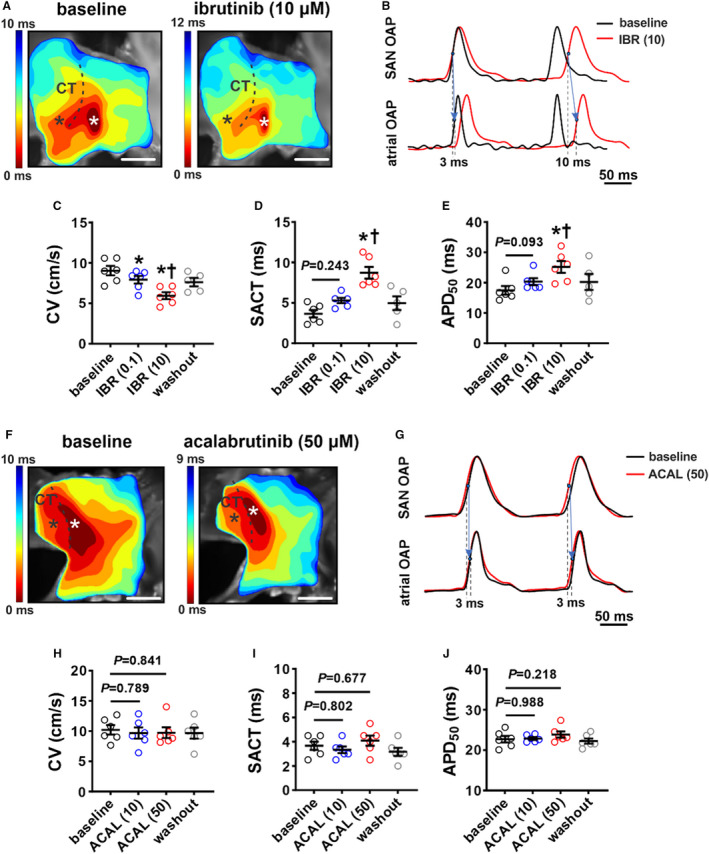
Figure 7. Effects of ibrutinib and acalabrutinib on sinoatrial node (SAN) electrophysiology.

A, Representative activation maps of the right atrial (RA) posterior wall containing the SAN, located adjacent to the crista terminalis (CT) at baseline and after superfusion with 10 µmol/L of ibrutinib (IBR (10)). Red indicates the earliest activation time corresponding to initial activation of the SAN. The color scale indicates total conduction time across the posterior wall. Scale bar: 2 mm. B, Representative optical action potentials (OAPs) from the initial activation site in the SAN region (white asterisk on activation map) and earliest RA activation site (black asterisk on activation map) at baseline and after superfusion with IBR (10). These OAPs were used to quantify SAN to atrial conduction time (SACT). C through E, Summary of the effects of ibrutinib on RA posterior wall conduction velocity (CV; C), SACT (D), and SAN action potential duration at 50% repolarization (APD50; E). For panels C–E: *P<0.05 vs baseline, † P<0.05 vs IBR (0.1) by mixed effects analysis with a Tukey post hoc test; n=5–6 hearts per group. F, Representative activation maps of the SAN region at baseline and after superfusion with 50 µmol/L acalabrutinib. Scale bar: 2mm. G, Representative OAPs from the initial pacemaker site in the SAN region and earliest RA activation site at baseline and after superfusion with 50 µmol/L of acalabrutinib (ACAL (10)). H through J, Summary of the effects of acalabrutinib on RA posterior wall CV (H), SACT (I), and SAN APD50 (J). For panels H–J: *P<0.05 vs baseline, † P<0.05 vs ACAL (10) by 1‐way repeated measures ANOVA with a Tukey post hoc test; n=5 hearts per group.
