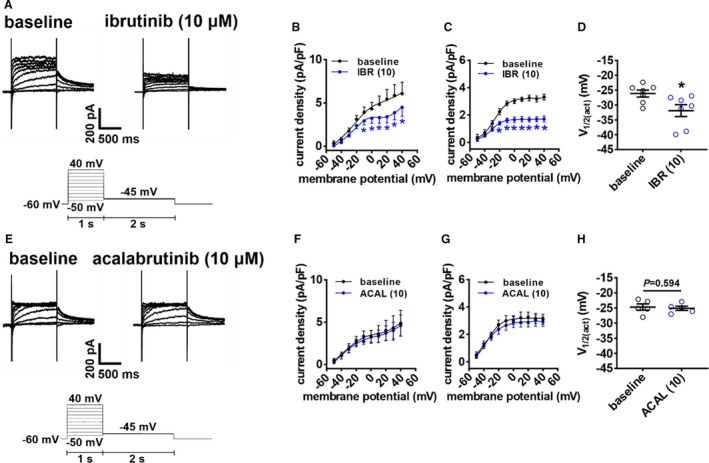
Figure 9. Effects of ibrutinib and acalabrutinib on the rapid delayed rectifier K+ current (IKr) in isolated sinoatrial node (SAN) myocytes.

A, Representative IKr recordings in isolated SAN myocytes at baseline and after application of 10 µmol/L of ibrutinib of (IBR (10)). Voltage clamp protocol shown below recordings. B, Peak total K+ current (IK(tot)) I‐V curves, measured at the end of the 1‐second depolarizing steps, at baseline and after application of IBR (10). C, Boltzmann fit of IKr tail currents (measured at −45 mV) at baseline and after application of IBR (10). D, Voltage for 50% channel activation (V1/2(act)) for IKr tail current at baseline and after application of IBR (10). For panels B–C: *P<0.05 vs baseline by 2‐way repeated measures ANOVA with a Tukey post hoc test; for panel D: *P<0.05 vs baseline by paired Student t test; n=7 SAN myocytes from 3 mice. E, Representative IKr recordings in isolated SAN myocytes at baseline and after application of 10 µmol/L of acalabrutinib (ACAL (10)). F, Peak IK I‐V curves, measured at the end of the 1‐second depolarizing steps, at baseline and after application of ACAL (10). G, Boltzmann fit of IKr tail currents (measured at −45 mV) at baseline and after application of ACAL (10). D, V1/2(act) for IKr tail current at baseline and after application of ACAL (10). For panels F–G: data analyzed by 2‐way repeated measures ANOVA with a Tukey post hoc test; for panel H: data analyzed by paired Student t test; n=5 SAN myocytes from 3 mice.
