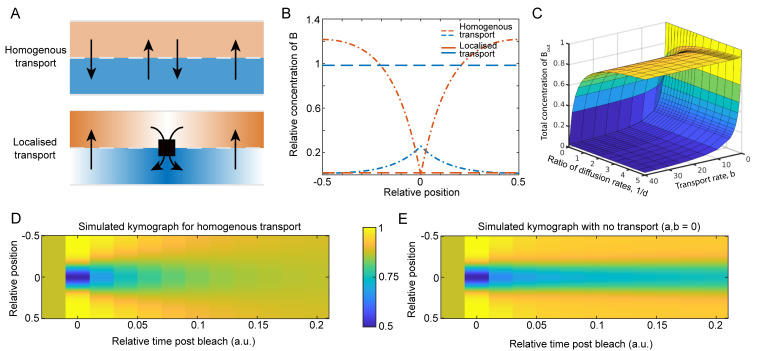
Fig 2. Localised transport is less efficient than homogenous transport.
(A) We compare two schemes for protein transport from the outer to inner periplasm: spatially uniformly across the length of the cell (homogeneous transport; top) and only at the centre of the cell (localised transport; bottom). In both cases the transport in the opposite direction, from inner to outer, is spatially uniform. Here, the blue and orange distinguish the inner and outer periplasm respectively. (B) Example line profiles of the concentration in the inner (blue) and outer (orange) periplasm for homogenous transport (dashed) and localised (dot-dashed) transport. The average transport rate is the same in both cases. Only the localisation of the transport differs. Note that there is more protein in the outer periplasm for localised transport. (C) A surface plot showing the total concentration of Bout(x,t), in the case of homogenous transport (lower surface) and localised transport (upper surface), as the dimensionless parameters d = Dout/Din and b = β0/αL are varied. Here a = αL2/Din. The parameters in (B) are a = 50, b = 100, and d = 0.2. See also S2 Fig. (D) Kymographs of simulated FRAP experiments with (left) and without (right) homogeneous transport. Both cases have the same steady state with the same concentration of molecules in the inner and outer periplasm. Note that the kymograph with transport returns to the initial steady state faster, showing how the transport-induced reshuffling of the slower sub-population increases the effective rate of diffusion of the entire population. Note that the system with no transport will eventually return to the initial steady state. In both kymographs d = 0.02, and with homogenous transport a = 50, and b = 1.

