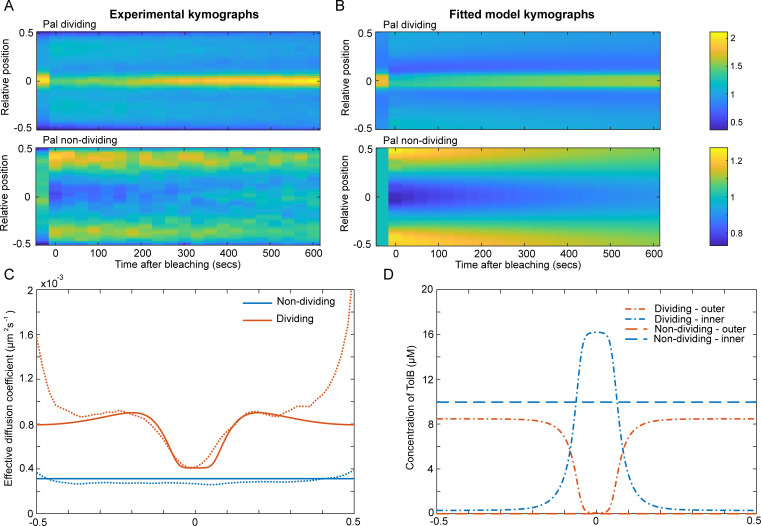
Fig 4. Fitting the model to experimental Pal SpatialFRAP.
(A) Kymographs of FRAP of Pal-mCherry performed averaged over 30 dividing (top) and non-dividing (bottom) cells. See also S3 Fig. (B) Simulated kymographs from the mathematical model showing the results for the best fit to the experimental data in (A). Colour bars are for both (A) and (B) and show either the normalised fluorescence (experimental data) or the normalised concentration (simulations). (C) Comparison between the effective diffusion coefficient computed using the SpatialFRAP method from the average experimental kymographs in (A) (dashed lines) and the best fit of the model (solid lines) for Pal in non-dividing (blue lines) and dividing (orange lines) cells. (D) The distribution of TolB in the inner (blue lines) and outer periplasm (orange lines) for dividing (dot-dash lines) and non-dividing (dashed lines) cells for the best fit shown in (B). Note the greater concentration of TolB in the outer periplasm of dividing cells (compare orange lines).

