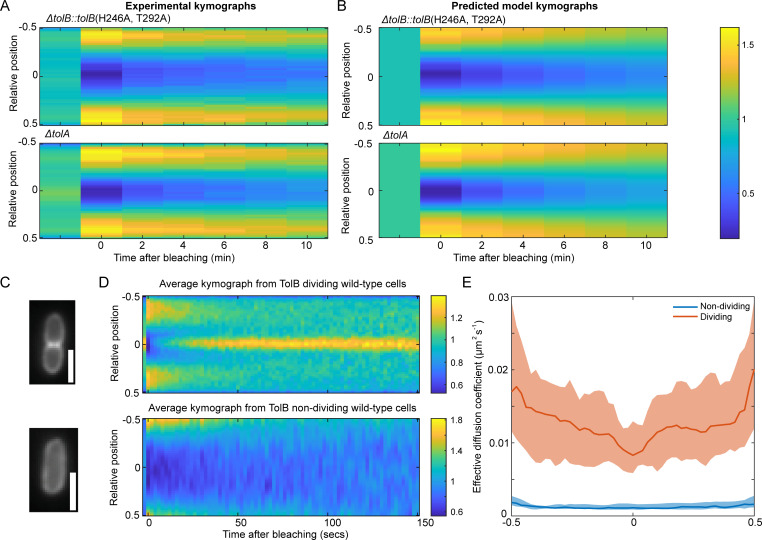
Fig 5. The model for the Tol-Pal system can predict the effects of mutants and TolB mobility.
(A) Kymographs of FRAP of Pal-mCherry averaged over 30 ΔtolB::tolB(H246A, T292A) (top) and ΔtolA (bottom) mutant cells. Data from reference [5]. (B) Predicted kymographs from the model using the fitting in Fig 4. See also S4 Fig. Colour bar is for both (A) and (B) and shows either the normalised fluorescence (experimental data) or normalised concentration (simulations). (C) Top, example cell showing the localisation of TolB-mCherry in dividing cells. Bottom, example cell showing the localisation of TolB-mCherry in non-dividing cells. In dividing cells, TolB is seen to be localised to the centre of the cells whereas in non-dividing cells it is homogeneously distributed, similarly to the distribution of Pal. Scale bar, 1 μm. (D) Experimental FRAP kymographs of TolB-mCherry showing the average from 30 dividing (top) and non-dividing (bottom) cells. Colour bars show normalised fluorescence. (E) Effective diffusion coefficient of TolB-mCherry in individual non-dividing cells (blue line) and dividing cells (orange line). In dividing cells, the diffusion coefficient is higher than in non-dividing cells. Based on the model, most TolB in dividing cells is in the outer periplasm whereas in non-dividing the majority is in the inner periplasm. This suggests that the diffusion coefficient of TolB in the outer periplasm is faster than that of TolB in the inner periplasm. Shown is the median of approximately 30 cells as a function of relative long axis position with 95% confidence intervals.

