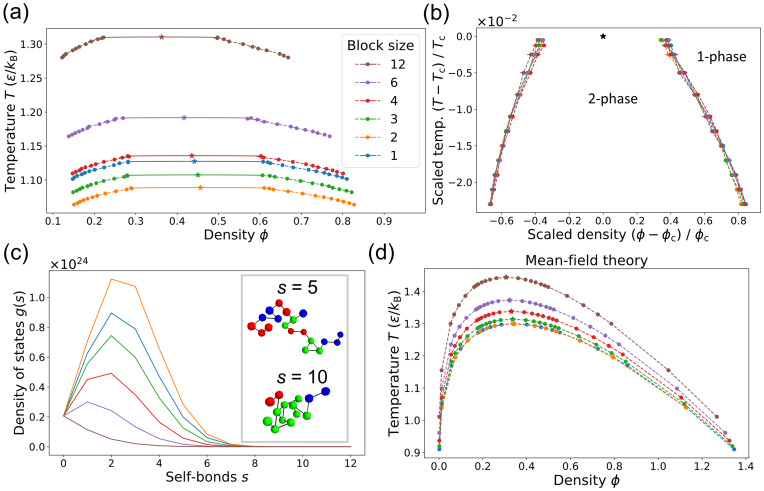
Fig 2. The sequence of binding motifs strongly affects a polymer’s ability to phase separate.
(a) Binodal curves defining the two-phase region for the six sequences of length L = 24 shown in Fig 1a. Stars indicate the critical points and the solid curves are fits to scaling relations for the 3D Ising universality class. Mean ± SD for three replicates. (Uncertainties are too small to see for most points.) Color key applies to all panels. (b) When rescaled by the critical temperature Tc and critical density ϕc, the phase boundaries in (a) collapse, even far from the critical point. (c) The tendency to phase separate is inversely related to the density of states g(s), i.e. the number of ways a given sequence can form s bonds with itself. Inset: Snapshots of ℓ = 3 polymer with s = 5 (top) and s = 10 (bottom). Black lines show the polymer backbone. (d) Phase boundaries from mean-field theory using g(s) (Eq 1).

