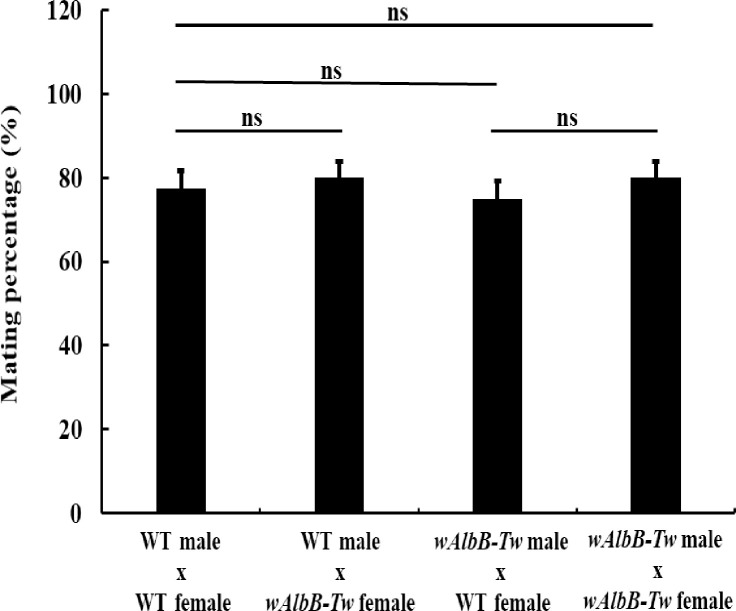
Fig 3. wAlbB-Tw male mating capacity analysis.
The panel shows the statistical analysis of mating success or failure in the four mating situations. Data are represented as mean ± SD. The difference between the WT and wAlbB-Tw was evaluated using t-test and p value less than 0.05 was considered statistically significant. ns, not significant.

