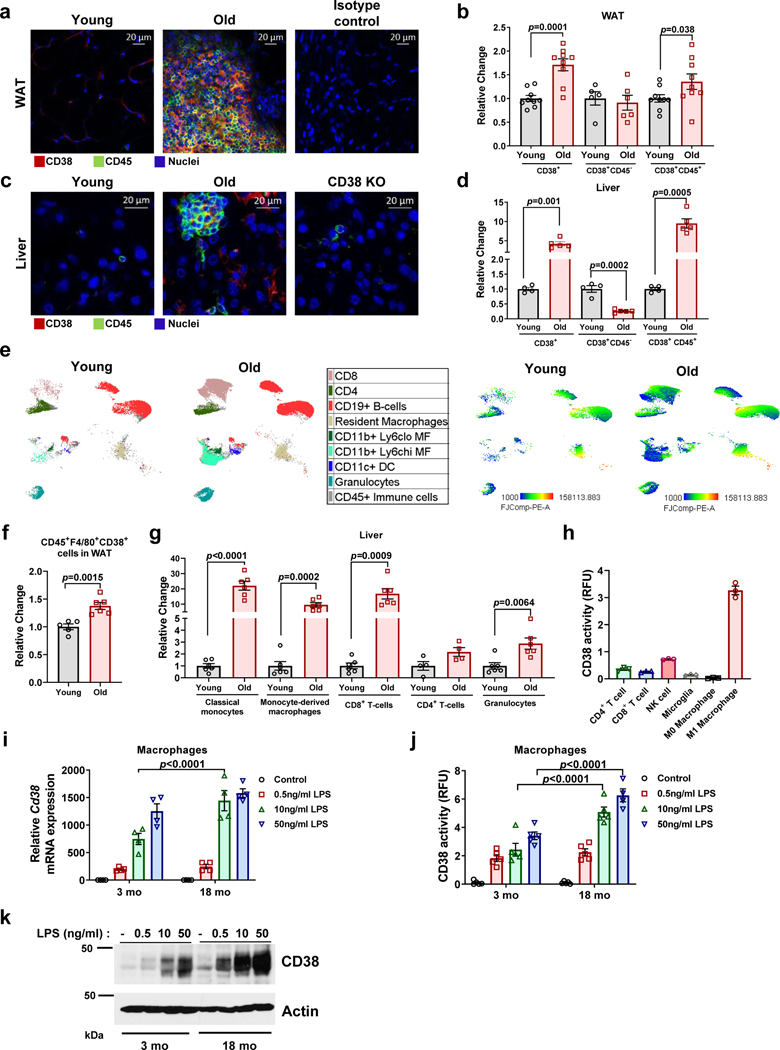
Figure 1. Characterization of CD38+ cell types that accumulate in tissues during aging.
Analysis of WAT (a,b,f) and liver (c,d,e,g) of young and old mice. (a,c) Representative immunofluorescence image for CD38 (red) and CD45 (green) in WAT and liver of young (3–4 month-old) and old (28–32 month-old) C57BL/6 mice (4 mice per group), compared to isotype control or CD38 Knockout (KO). (b,d) CD38+, CD38+CD45−, and CD38+CD45+ cells in young (4 month-old) and old (32 month-old) mice were determined by flow cytometry in WAT (CD38+, CD38+CD45+ n=9 mice per group; CD38+CD45− n=5 mice for young, 6 mice for old) and liver (young n=4 mice per group; old n=5 mice per group), changes are relative to young mice. (e) In the left panel, flow cytometry-derived color-coded cell clusters of CD38+ immune cell types in liver of young (4 month-old) and old (32 month-old) mice analyzed by Uniform Manifold Approximation and Projection (UMAP). In the right panel, heat maps show CD38 protein expression (lowest in blue and highest in red) in the respective immune clusters (n=4 for young and n=5 for old). (f) Graph shows CD45+F4/80+CD38+ cell population in WAT of young (4 month-old, n=5 mice) and old mice (32 month-old, n=6 mice). Fold changes are relative to young mice. (g) CD38+CD45+ subsets increase with age in liver tissue (Classical monocytes, monocyte-derived macrophages, CD8+ T cells, and granulocytes n=6 mice; CD4+ T cells n=4 mice). Change is relative to young mice. (h) CD38 activity in mouse immune cells isolated from spleen (n=3 biologically independent samples). (i-k) Macrophages isolated from 3 month-old and 18 month-old mice were stimulated with different concentrations of LPS for 20 hours. (i) Cd38 mRNA expression measured by qRT-PCR analysis (n=4 biologically independent samples). (j) CD38 activity measured in protein lysates (RFU-relative fluorescent units) (n=5, except for 18 mo 50 ng/mL LPS where n=4 biologically independent samples). (k) Representative immunoblotting of three biologically independent samples from macrophages treated with different concentrations of LPS. Data are mean ± SEM, analyzed by unpaired two-sided t-test, except for CD38+CD45+ in Fig 1b, where samples were analyzed by unpaired on-sided t-test.

