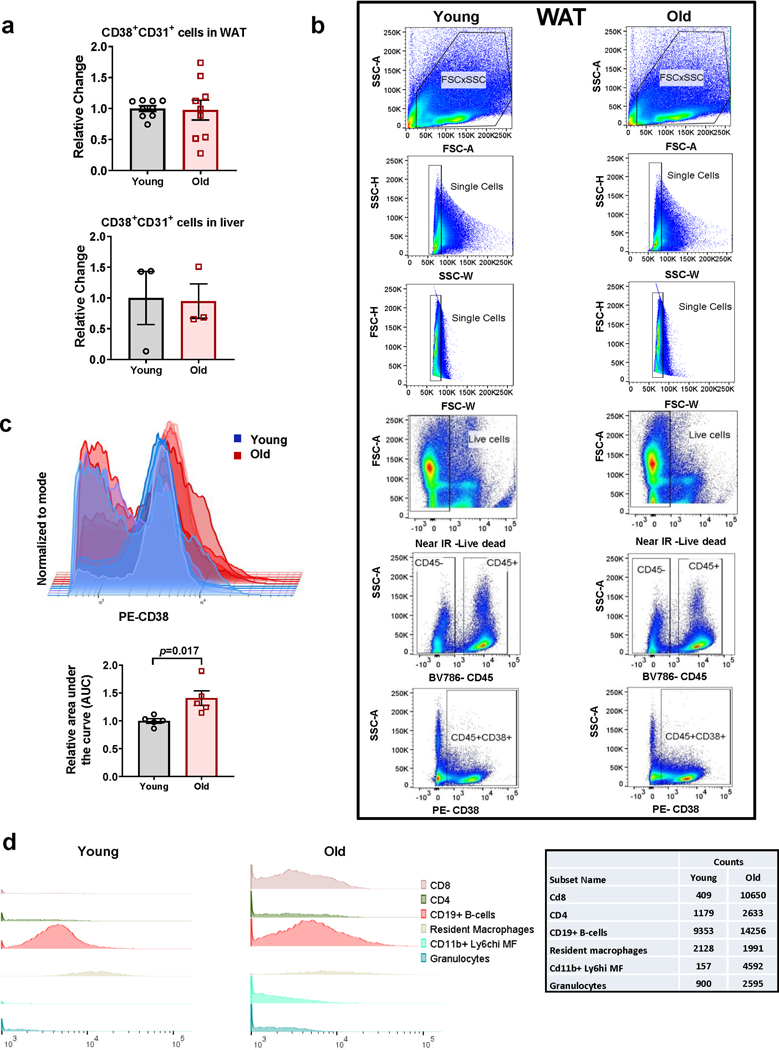
Extended Data Fig. 1. CD38+ cells increase in tissues with aging.
(a) Graphs show no change in CD38+CD31+ cell population in WAT and liver tissues between young (4 month-old) and old (32 month-old) mice (n=3 for liver and n=9 mice for WAT). (b) Gating strategy used to show the CD45+CD38+ population in WAT of young (4 month-old) and old (22 month-old) mice. (c) Histograms of CD38+ population in young (4 month-old) and old (22 month-old) WAT showing the shift in CD38 expression. The graph shows the relative area under the curve (AUC) for young and old (n=5 mice per group). (d) Histograms showing the CD38 expression in different immune cells in young (4 month-old) and old (32 month-old) liver. Table shows cell counts for each subset of immune cells, the data are representative of n=5 mice per group. (e) Gating strategy for CD45+ immune subsets in CD38+ liver cells in young (4 month-old) and old mice (32 month-old). Data are mean ± SEM, analyzed by unpaired two-sided t-test.

