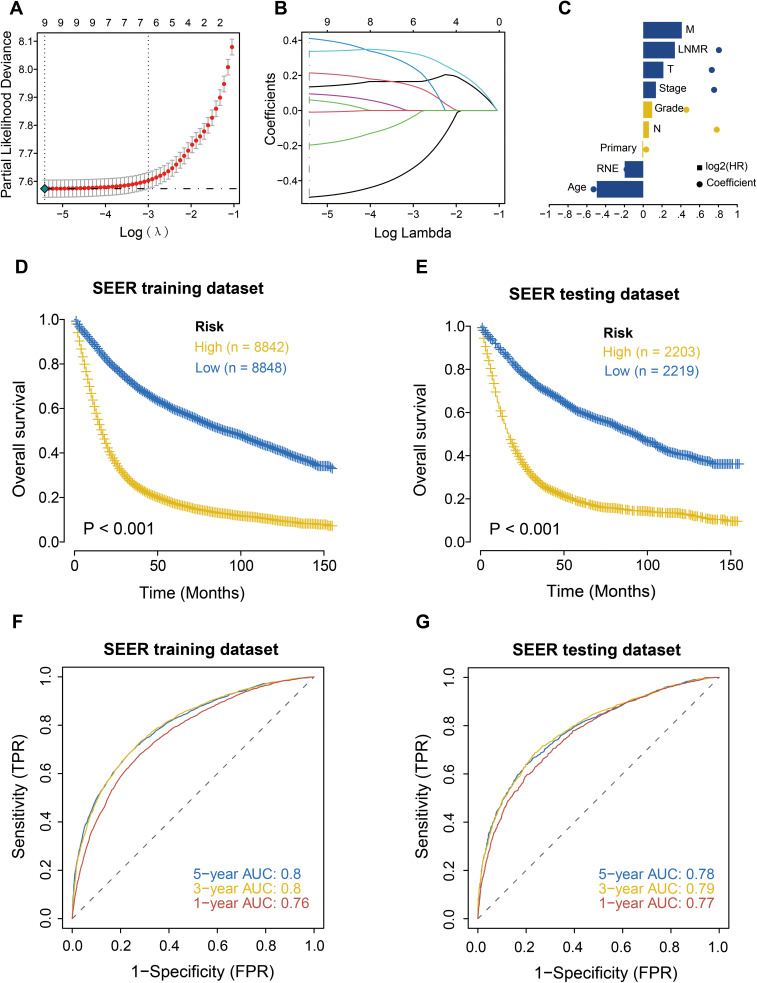
Figure 3.
Construction of prognostic model of postoperative gastric cancer patients in the SEER database and survival analysis of high and low risk groups. (A) Misclassification error of different quantitative variables revealed by the LASSO regression model. The red dot represents the misclassification error value, gray line represents the standard error (SE), and left and right vertical dashed lines represent the optimal value under the minimum criterion and 1-SE criterion, respectively, and “lambda” is the tuning parameter. (B) Variation in coefficient values (Coefficients) corresponding to the variables with the lambda value of the tuning parameter. (C) Characteristic coefficient diagram of the LASSO regression model. The dots represent the model coefficients and bar graphs represent log2 (HR). (D) Survival analysis of the high and low risk groups in the training set. Yellow represents the high-risk group, and blue represents the low-risk group. (E) Survival analysis of the high and low risk groups in the internal validation set. Yellow represents the high-risk group, and blue represents the low-risk group. (F) ROC analysis of risk score in training set (1, 3, 5 years). (G) ROC analysis of risk score in internal validation set (1, 3, 5 years).

