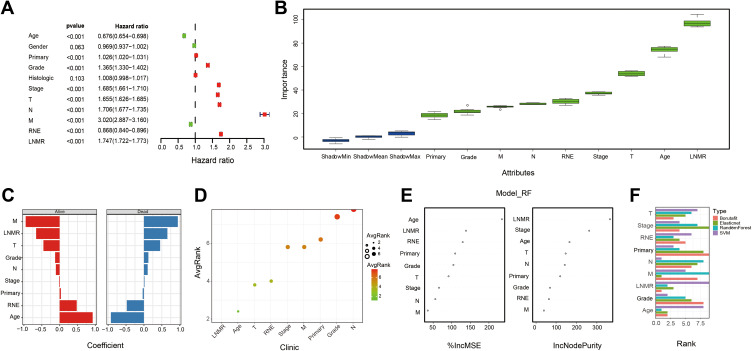
Figure 5.
Feature selection of postoperative patients with gastric cancer in the SEER database. (A) Univariate Cox regression forest plot for feature selection. Regression analysis was performed on each clinical feature using the Cox proportional hazard model. The red dots indicate that the clinical feature is significantly related to survival (p < 0.05). (B) Feature selection of Boruta algorithm. The Boruta algorithm was used to obtain the importance of each clinical feature, and the value of importance was used to reflect the correlation between the feature and survival. (C) Feature selection of Elasticnet algorithm to obtain the importance of each clinical feature and reflect the impact of the feature on survival through the size of risk coefficient of each feature. (D) Feature selection of SVM algorithm. The machine learning method based on SVM sorted the scores of each feature, and finally selected the required features. (E) Feature selection of the Random Forest algorithm. %IncMSE means increase in mean squared error. The larger the value, the greater the importance of the variable; IncNodePurity means increase in node purity. The larger the value, the greater the importance of the variable. This study evaluated the importance of features according to %IncMSE. (F) Ranking summary of the importance of clinical information features of gastric cancer.

