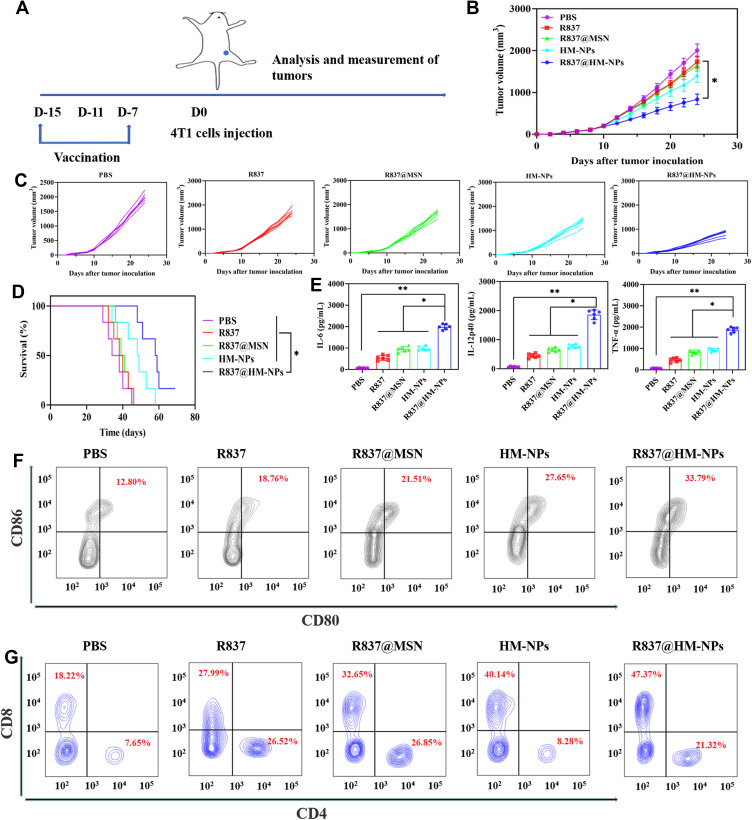
Figure 4.
The preventive efficacy of R837@HM-NPs nanovaccine for tumor occurrence in vivo. (A) Schemes of tumor prevention experiment design. The average tumor growth curves (B) and individual tumor growth curves (C) for different groups of mice as indicated (n = 6). (D) Survival curves as a function of treatment type. (E) Cytokine concentrations including IL-6, IL-12p40 and TNF-α in serum from treated mice. (F) Representative flow cytometry data to show DCs maturation in lymph nodes induced by different treatments in vivo. (G) Flow cytometric analysis of CD4+ and CD8+ T cells in tumors, gated on CD3+ T cells. *P < 0.05, **P < 0.01.

