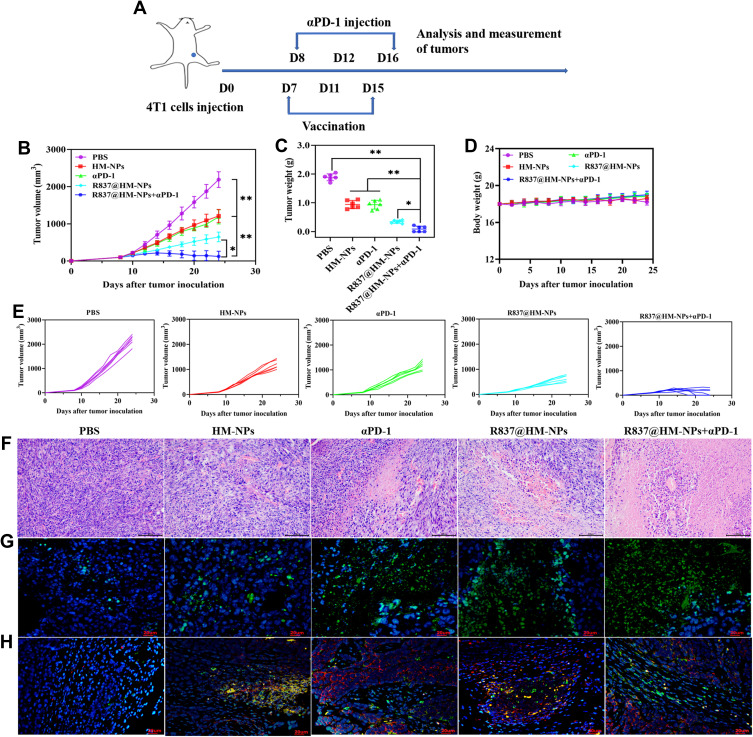
Figure 5.
In vivo therapeutic effect of R837@HM-NPs nanovaccine in combination with αPD-1. (A) Schematic illustration of combining R837@HM-NPs-based vaccination with αPD-1 therapy to inhibit established 4T1 tumors. The average tumor growth curves (B) and individual tumor growth curves (E) for different groups of mice as indicated (n = 6). (C) Weights of tumors from 4T1-bearing mice receiving different treatments. (D) Body weight profiles of tumor-bearing mice during treatment. Representative H&E (F) and TUNEL (G) images of tumor tissues in different treatment groups at the end of the experiments. Cell nuclei were stained blue, and TUNEL was stained green. Scale bar, 100 μm (HE); 20 μm (TUNEL). (H) Representative immunofluorescence images of tumors showing CD8+ (green) and CD4+ (red) infiltration in the tumor tissues for all the treatment groups. Scale bar, 20 μm. *P < 0.05, **P < 0.01.

