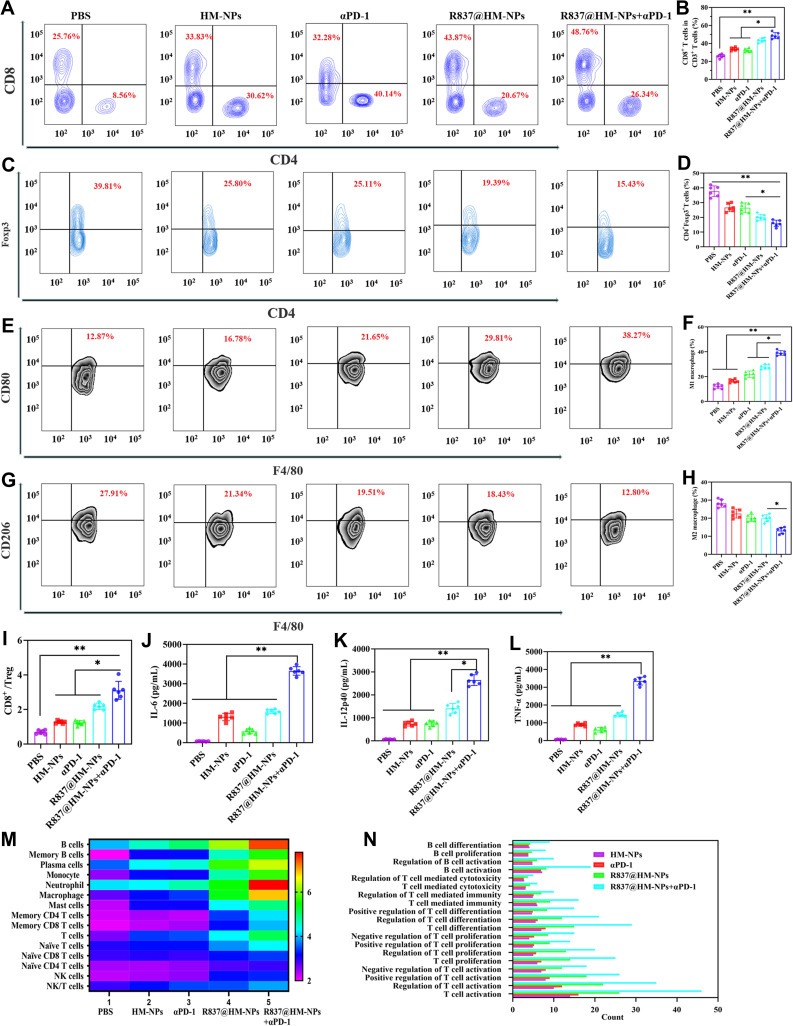
Figure 6.
The immune activation mechanism of R837@HM-NPs in combination with αPD-1 on inhibition of 4T1 tumor growth. Representative flow cytometry data of tumor infiltrating CD4+CD8+T cells (A), CD4+Foxp3+T cells (C), CD80+CD11b+F4/80+ cells (E), and CD206+CD11b+F4/80+ cells (G) for different groups of mice after various treatments. Representative statistical data of tumor infiltrating CD4+CD8+T cells (B), CD4+Foxp3+T cells (D), CD80+CD11b+F4/80+ cells (F), and CD206+CD11b+F4/80+ cells (H) for different groups of mice after various treatments. (I) Flow cytometric analysis assessing the relative abundance of CD8+/Treg for different groups of mice after various treatments. Cytokine levels of IL-6 (J), IL-12p40 (K), and TNF-α (L) in serum from tumor-bearing mice isolated at 48 h after the last injection. (M) Heat map analysis of ex tumors after receiving different treatments as indicated through transcriptome sequencing (RNA-seq). (N) Gene ontology biological process analysis of ex tumors after receiving different treatments as indicated. *P < 0.05, **P < 0.01.

