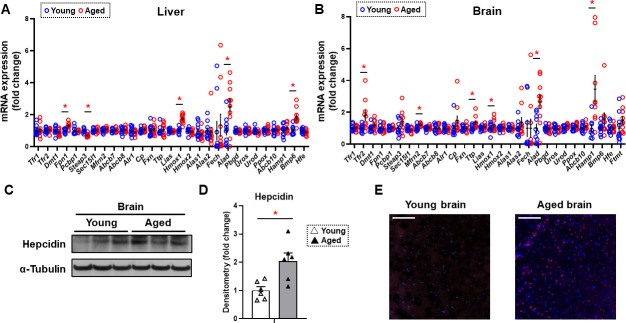
Figure 2. Hepcidin protein expression is significantly increased in the aged brain cortex.
mRNA levels of proteins involved in iron regulation in the liver (A) and brain (B) in young (4 months old) and old (22 months old) mice (n=10/group). Means and SEM are indicated as horizontal and vertical bars, respectively. An undetected measurement (n=1) in the brain Fech and undetected measurements (n=2) and an outlier (n=1) in the brain Hamp1 were excluded. Tfr1 = transferrin receptor 1, Tfr2 = transferrin receptor 2, Dmt1 = divalent metal transporter 1, Fpn1 = ferroportin 1, Pcbp1 = Poly(RC) Binding Protein 1, Steap3 = Metalloreductase Six-Transmembrane Epithelial Antigen Of Prostate 3, Sec15l1 = exocyst complex component 6, Mfrn2 = mitoferrin 2, Abcb7 = ATP-binding cassette sub-family B member 7, Abcb8 = ATP-binding cassette sub-family B member 8, Alr1 = augmenter of liver regeneration, Cp = ceruloplasmin, Fxn = frataxin, Ttp = tristetraprolin, Lias = tristetraprolin, Hmox1 = heme oxygenase 1, Hmox2 = heme oxygenase 2, Alas1 = 5′-aminolevulinate synthase 1, Alas2 = 5′-aminolevulinate synthase 2, Fech = ferrochelatase, Alad = aminolevulinate dehydratase, Pbgd = porphobilinogen deaminase, Uros = uroporphyrinogen III synthase, Urod = uroporphyrinogen decarboxylase, Ppox = protoporphyrinogen oxidase, Abcb10 = ATP-binding cassette, sub-family B member 10, Hamp1 = hepcidin1, Bmp6 = bone morphogenetic protein 6, Hfe = homeostatic iron regulator, Ftmt = mitochondrial ferritin. (C) Representative immunoblot for hepcidin1 in the brain (n=6). (D) Summary of densitometry analysis of panel (C). (E) Representative immunohistochemistry of hepcidin1 (Red = anti-hepcidin1, blue = DAPI) in the brain frontal cortex of young and aged mice. Scale bar=200 µm. * p<0.05.

