. 2022 Jan 11;11:e70017. doi: 10.7554/eLife.70017

Figure 2. Cfr variants cause increased methylation of 23S rRNA at A2503, correlating with enhanced production of Cfr protein.

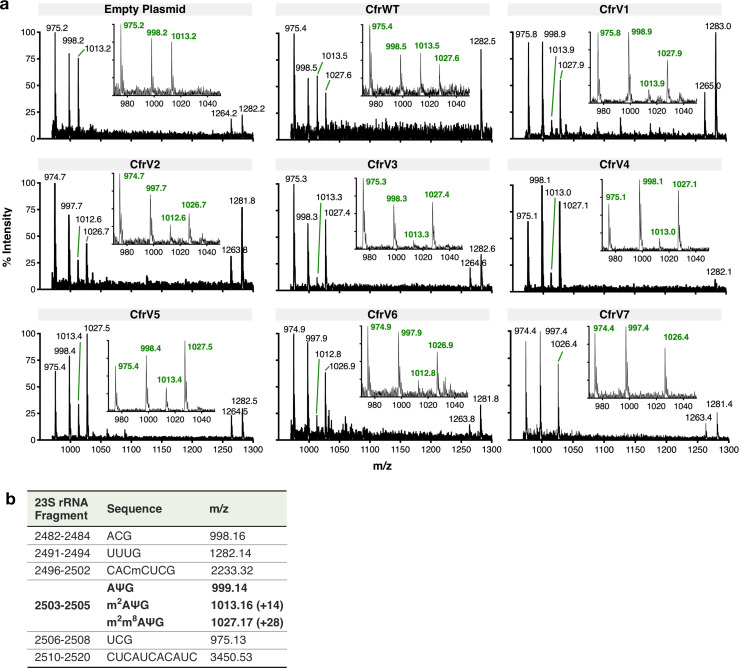
(a) Endogenously modified (m2A2503) and Cfr-hypermodified (m2m8A2503) rRNA fragments correspond to m/z values of 1013 and 1027, respectively. MALDI-TOF mass spectra of 23S rRNA fragments isolated from Escherichia coli expressing CfrWT, and evolved Cfr variants V2, V4, and V7. Ψ is pseudouridine, m2A is 2-methyladenosine, is m2m8A is 2,8-dimethyladenosine. (b) Relative protein expression of full-length Cfr variants compared to full-length CfrWT detected by immunoblotting against a C-terminal FLAG tag and quantification of top Cfr bands. Signal was normalized to housekeeping protein RNA polymerase β-subunit. Data are presented as the average of four biological replicates with standard deviation on a log2 axis. Asterisks denote N-terminally truncated versions of Cfr that do not contribute to resistance. Em = empty vector control. Original uncropped blot images are provided in Figure 2—source data 1. (c) Relative transcript levels for variants compared to CfrWT determined from three biological replicates with standard deviation. Statistical analysis was performed using a two-tailed t-test on log2 transformed data. (d) Percentage of total Cfr expression attributed to the production of full-length Cfr protein, presented as the average of four biological replicates with standard deviation. (e) Doubling times for E. coli expressing empty plasmid, CfrWT, or Cfr variants were determined from three biological replicates with standard error. Numerical data and exact p values where relevant for panels (b–d) are provided in Figure 2—source data 2.

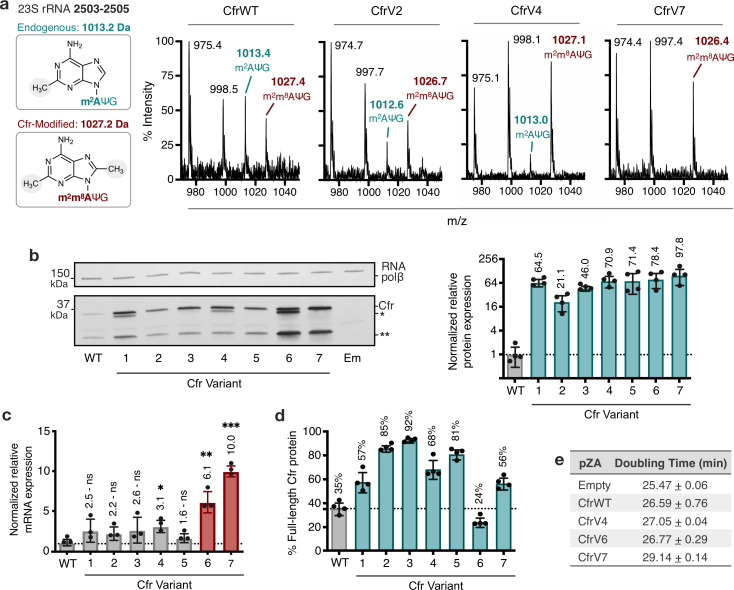
Figure 2—source data 1. Blot images.
Figure 2—source data 2. Numerical and statistical data.
Figure 2—source data 3. Numerical data.
Figure 2—source data 4. Blot images.
Figure 2—source data 5. Blot images.
Figure 2—source data 6. Numerical data.
Figure 2—source data 7. Numerical data.

Figure 2.

Figure 2—figure supplement 1. MALDI-TOF mass spectra of 23S rRNA fragments produced by oligo-protection and RNase T1 digestion.

Figure 2—figure supplement 1.

(a) RNA isolated from Escherichia coli with empty pZA vector or expressing CfrWT and evolved Cfr variants CfrV1–V7. Spectra are representative of 2–3 biological replicates. Endogenously modified (m2A) and Cfr-modified rRNA fragments (m2m8A) correspond to m/z values of 1013 and 1027, respectively. (b) Expected rRNA fragments and m/z values produced by RNase T1 digestion of C2480–C2520 23S rRNA nucleotides after oligo-protection. Peaks ~1264 m/z corresponds to the cyclic phosphate of the UUUG rRNA fragment. Cm is methylated cytosine, Ψ is pseudouridine, m2A is 2-methyladenosine, and m2m8A is 2,8-dimethyladenosine.
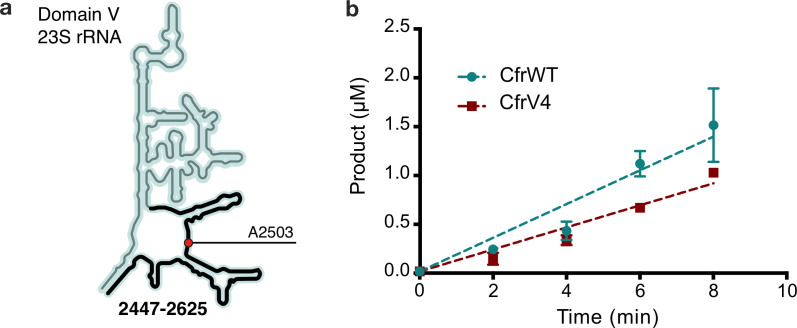
Figure 2—figure supplement 2. In vitro characterization of CfrWT and CfrV4.

Figure 2—figure supplement 2.

(a) Schematic representation of 23S rRNA domain V secondary structure highlighting the rRNA fragment 2447–2625 used in the kinetic assay. Position of the Cfr substrate nucleotide A2503 is indicated by a red circle. (b) Time-dependent formation of methylated rRNA product by CfrWT or evolved CfrV4 in reactions containing 5 µM apo-reconstituted Cfr enzyme, 100 µM 23S rRNA fragment 2447–2625, and 2 mM [3H-methyl] S-adenosylmethionine. Values are presented as the average and standard error of two replicates. Turnover numbers for CfrWT and CfrV4 are 3.45×10⁻²±3.2×10⁻³ min–1 and 2.25×10⁻²±1.3×10⁻³ min–1, respectively. Numerical data are provided in Figure 2—source data 3.
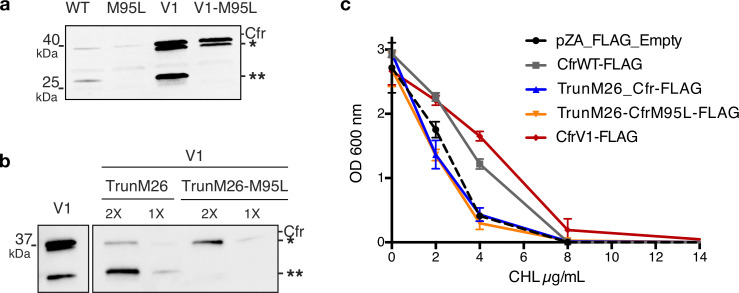
Figure 2—figure supplement 3. N-terminally truncated Cfr products arise from internal Met translation start sites and do not contribute to resistance.

Figure 2—figure supplement 3.

(a) Detection of Cfr protein products by immunoblotting against C-terminal FLAG tag. Directed evolution mutation I26M is sufficient to produce the higher-molecular weight truncated species (denoted by *). Mutation of M95L (AUG -> CUG) abolishes the production of smaller truncated species (denoted by **). Blot is representative of two biological replicates. Original uncropped blot images are shown in Figure 2—source data 4. (b) Detection of Cfr protein products by immunoblotting against C-terminal FLAG tag with ANTI-FLAG M2-Peroxidase antibody (Sigma). TrunM26 refers to a Cfr construct where amino acids 1–25 have been eliminated. This construct yields predominately species **, with * as the minor expressed protein. TrunM26-M95L eliminates amino acids 1–25 and also removes the internal Met start site through M95L mutations, yielding species *. Original uncropped blot images are shown in Figure 2—source data 5. (c) Dose-dependent growth inhibition of Escherichia coli expressing N-terminally truncated Cfrs in the presence of chloramphenicol (CHL). Results presented as the average of two biological replicates with standard error. Numerical data are provided in Figure 2—source data 6.
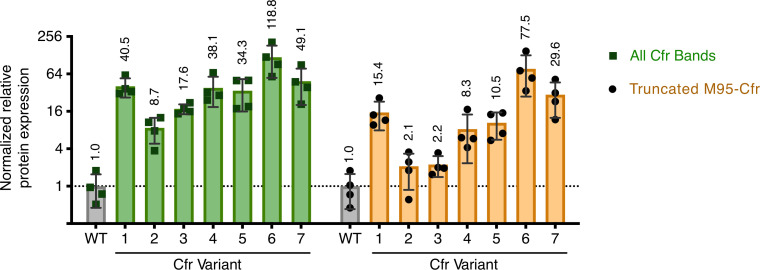
Figure 2—figure supplement 4. Quantification of Cfr bands observed upon expression of Cfr variants.

Figure 2—figure supplement 4.

Relative protein expression of all Cfr-FLAG bands (green) or band corresponding to the N-terminal truncation at Met95 (yellow) for Cfr variants compared to CfrWT detected by immunoblotting against a C-terminal FLAG tag. Signal was normalized to housekeeping protein RNA polymerase β-subunit. A representative western blot is presented in Figure 2b. Data are presented as the average of four biological replicates with standard deviation on a log2 axis. Original uncropped blot images are shown in Figure 2—source data 1. Numerical data are provided in Figure 2—source data 7.