. 2022 Jan 11;11:e70017. doi: 10.7554/eLife.70017

Figure 3. Mutations to the second amino acid and promoter are the largest contributors to Cfr expression and resistance.

(a) Effect of Cfr mutations and promoter alteration on relative Cfr protein expression was assessed by immunoblotting against a C-terminal FLAG tag. Quantification was performed for full-length Cfr protein normalized to housekeeping protein RNA polymerase β-subunit. Data are presented as the average of four biological replicates with standard deviation on a log2 axis. Asterisks denote N-terminally truncated Cfr protein products that do not contribute to resistance and were not included in quantification. Em = empty vector control. Original uncropped blot images are shown in Figure 3—source data 1. (b) and (c) Dose-dependent growth inhibition of Escherichia coli expressing pZA-encoded CfrWT, CfrV6 (panel (b)), CfrV3 (panel (c)), and individual mutants that comprise these variants toward chloramphenicol (CHL) presented as an average of three biological replicates with standard error. Numerical data for all figure panels are provided in Figure 3—source data 2.

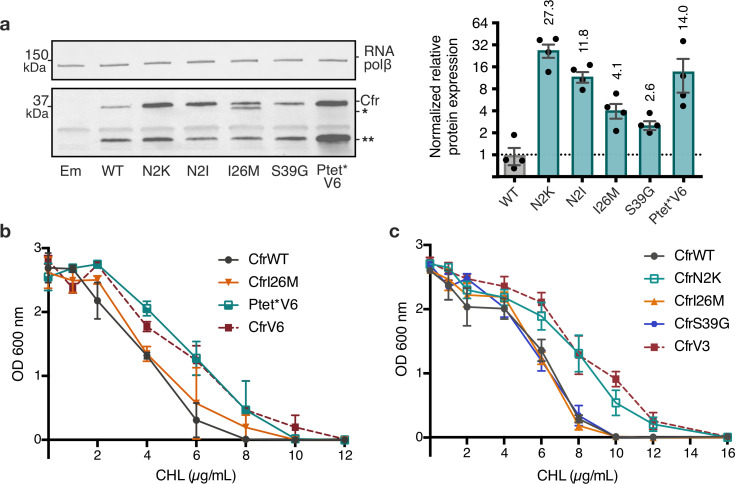
Figure 3—source data 1. Blot images.
Figure 3—source data 2. Numerical data.
Figure 3—source data 3. Numerical data.
Figure 3—source data 4. Blot images.
Figure 3—source data 5. Numerical data.

Figure 3.

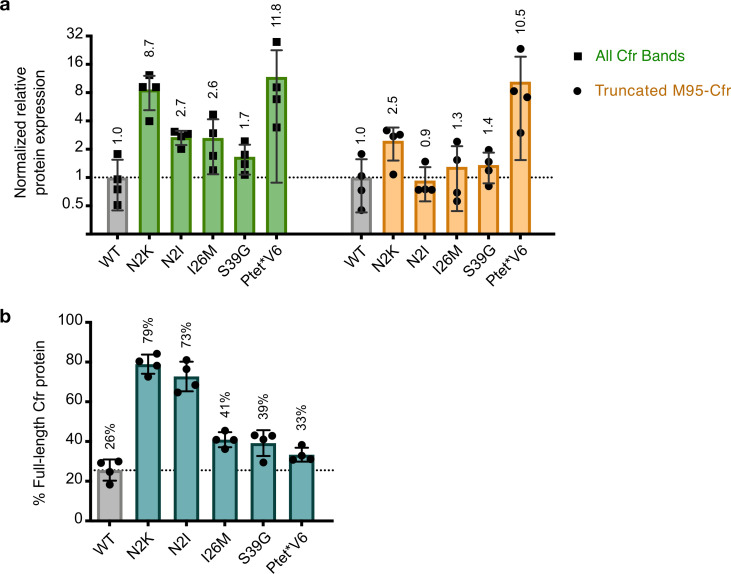
Figure 3—figure supplement 1. Quantification of Cfr bands observed upon expression of Cfr Ptet*V6 or single mutations.

Figure 3—figure supplement 1.

(a) Relative protein expression of all Cfr-FLAG bands (green) or band corresponding to the N-terminal truncation at Met95 (yellow) for Cfr mutants compared to CfrWT detected by immunoblotting against a C-terminal FLAG tag. Signal was normalized to housekeeping protein RNA polymerase β-subunit. A representative western blot is presented in Figure 3a. Data are presented as the average of four biological replicates with standard deviation on a log2 axis. (b) Percentage of total Cfr expression attributed to production of full-length Cfr protein, presented as the average of four biological replicates with standard deviation. Original uncropped blot images are shown in Figure 3—source data 1. Numerical data for panels in this figure are provided in Figure 3—source data 3.
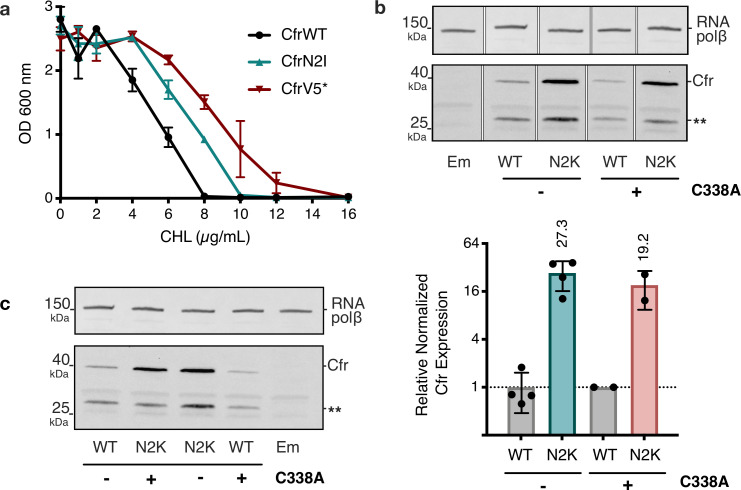
Figure 3—figure supplement 2. Investigations into second position Cfr mutations N2I and N2K.

Figure 3—figure supplement 2.

(a) Dose-dependent growth inhibition of Escherichia coli expressing CfrN2I compared to CfrV5 toward chloramphenicol (CHL). Results presented as an average of three biological replicates with standard error. (b) Relative expression of CfrN2K compared to CfrWT, in the presence or absence of an additional C338A mutation that renders Cfr catalytically inactive. Therefore, in constructs carrying the C338A mutation, Cfr constructs are produced by ribosomes that lack the m8A2503 modification. Signal of full-length Cfr protein was normalized to housekeeping protein RNA polymerase β-subunit, presenting the average of two biological replicates and standard deviation on a log2 axis. Asterisks denote truncated Cfr products that do not contribute to resistance and were not included in quantification. (c) Original, uncropped image of panel (a). Em = empty vector control. Original uncropped blot images are shown in Figure 3—source data 4. Numerical data for panels in this figure are provided in Figure 3—source data 5.