. 2022 Jan 11;11:e70017. doi: 10.7554/eLife.70017

Figure 4. Directed evolution mutations impact Cfr translation and degradation.

(a) Sucrose gradient fractionation of polysomes from Escherichia coli expressing empty vector or CfrWT/N2K/V4 denoting fractions corresponding to low- and high-density polysomes. (b) mRNA distribution of well-translated, housekeeping gene recA across polysome profiles. (c) mRNA distribution of Cfr transcripts expressing CfrWT or CfrN2K. (d) mRNA distribution of Cfr transcripts expressing CfrWT or CfrV4. For (b–d), transcript levels for each fraction were determined by RT-qPCR and normalized by a luciferase mRNA control spike-in. Values presented as the average of three biological replicates with standard error. (e) Protein degradation kinetics of CfrWT, single mutations CfrN2K/N2I/S39G/I26M, and evolved variant CfrV3 in E. coli after halting expression by rifampicin treatment. Percentage of Cfr protein remaining over time was determined by immunoblotting against C-terminal FLAG tag and presented as the average of three biological replicates with standard error. Original uncropped blot images are shown in Figure 4—source data 1. Numerical data for all figure panels are provided in Figure 4—source data 2.

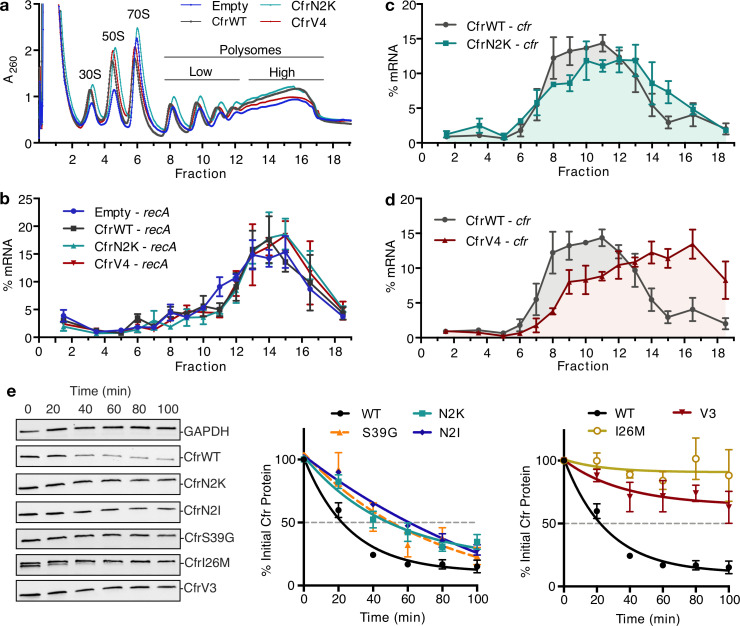
Figure 4—source data 1. Blot images.
Figure 4—source data 2. Numerical data.
Figure 4—source data 3. Numerical data.
Figure 4—source data 4. Blot images.
Figure 4—source data 5. Numerical data.

Figure 4.

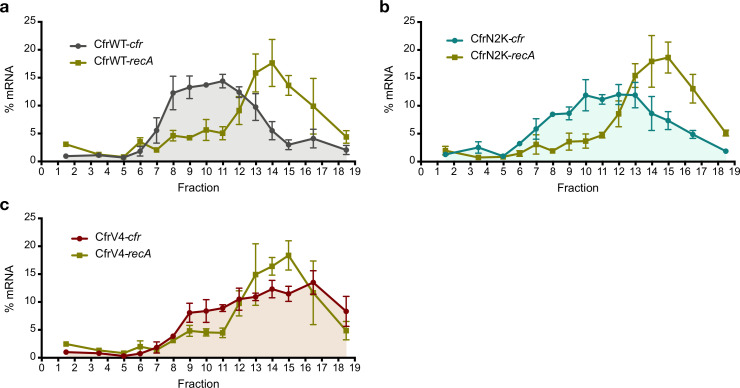
Figure 4—figure supplement 1. Investigating translation of Cfr mutants.

Figure 4—figure supplement 1.

Distribution of Cfr and recA transcripts across polysome profiles from Escherichia coli expressing (a) pZA-encoded CfrWT, (b) CfrN2K, and (c) CfrV4. Transcript levels for each fraction isolated from a 10–55% sucrose gradient were determined by RT-qPCR and normalized by a luciferase mRNA control spike-in. Values are presented as the average of three biological replicates with standard error. Numerical data for panels in this figure are provided in Figure 4—source data 3.
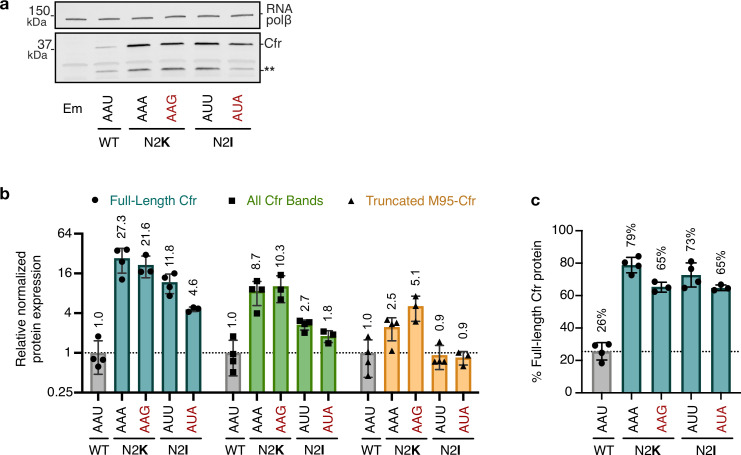
Figure 4—figure supplement 2. Impact of second codon identity on Cfr expression.

Figure 4—figure supplement 2.

(a) Cfr protein levels were assessed by immunoblotting against a C-terminal FLAG tag. Mutations away from the directed evolution mutation are in red lettering. Asterisks denote the truncated Cfr products that do not contribute to resistance. Em = empty vector control. (b) Relative protein expression of full-length Cfr (teal), all Cfr bands (green), and the truncation corresponding to translation initiation at Met95 (yellow) for second codon mutants compared to CfrWT. Signal was normalized to housekeeping protein RNA polymerase β-subunit. Data are presented as the average of three or four biological replicates with standard deviation on a log2 axis. Original uncropped blot images are shown in Figure 4—source data 4. (c) Percentage of total Cfr expression attributed to the production of full-length Cfr protein, presented as the average of three or four biological replicates with standard deviation. Numerical data for panels in this figure are provided in Figure 4—source data 5.
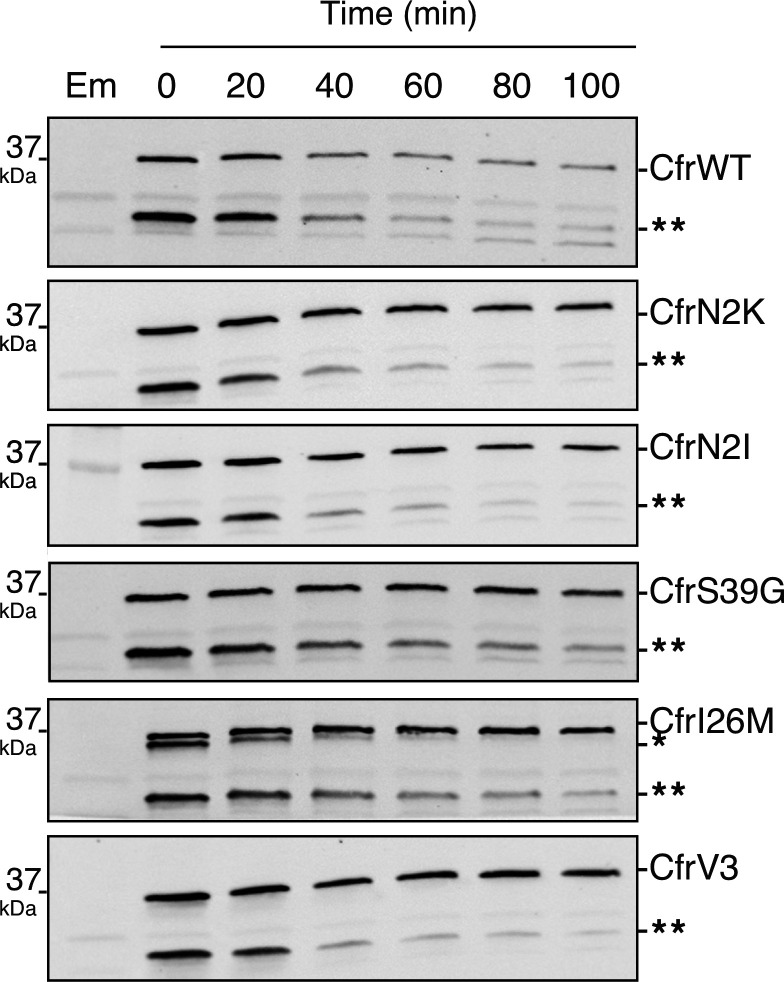
Figure 4—figure supplement 3. Degradation of Cfr protein products.

Figure 4—figure supplement 3.

Protein degradation kinetics of CfrWT, single mutations CfrN2K/N2I/S39G/I26M, and evolved variant CfrV3 in Escherichia coli after halting expression by rifampicin and immunoblotting against the C-terminal FLAG tag. Presented western blots are expanded images of those presented in Figure 4 to display degradation of the Cfr truncation denoted by two asterisks (**). Em = empty vector control. Original uncropped blot images are shown in Figure 4—source data 1.
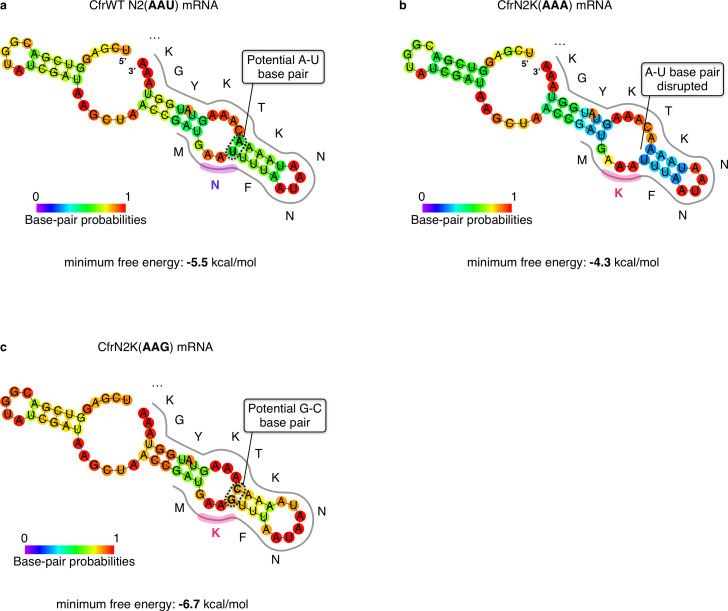
Figure 4—figure supplement 4. RNA secondary structure predictions of the sequence region proximal to the Cfr start codon.

Figure 4—figure supplement 4.

Minimum free energy secondary structure prediction by RNAfold v2.4.8 (Lorenz et al., 2011) of the 30 mRNA nucleotides upstream and downstream of the Cfr AUG start codon for (a) CfrWT, (b) CfrN2K(AAA), and (c) CfrN2K(AAG). Bases are colored according to their base-pair probabilities.
Figure 4—figure supplement 5. Protein sequence alignment of Cfr and Cfr homologs.

Figure 4—figure supplement 5.

CfrWT used for the starting point for directed evolution is displayed as the top sequence (Cfr) in blue. Cfr(B), Cfr(C), Cfr(D), and Cfr(E) are Cfr homologs that have been functionally characterized, reviewed here (Schwarz et al., 2021). Remaining sequences are Cfr homologs that clade with Cfr or Cfr-like genes as described previously (Stojković et al., 2019). Percent shared amino acid identity (% Id) with Cfr is noted. Directed evolution mutations N2K, I26M, and S39G are highlighted with red lettering. Alignment was performed using MUSCLE (Edgar, 2004) and the first ~60 residues are displayed. Cfr homologous sequences were derived from the following organisms: Staphylococcus aureus (AJ879565), Clostridioides difficile (KM359438), Clostridioides difficile T10 (CCL89685), Enterococcus faecium (MG707078), Firmicutes (WP_105119688.1), Bacillus amyloliquefaciens (2511698410), Brevibacillus brevis (643787315), Geobacillus sp. Y412MC10 (646363554), Bacillus clausii (2815943689), Clostridium saccharoperbutylacetonicum (2609355091), Clostridium sporogenes (642847821), Clostridium acidurici (2517499511), Clostridium mangenotii (2558672851), and Clostridium phytofermentans (641293316).