. 2022 Jan 11;11:e70017. doi: 10.7554/eLife.70017

Figure 5. Near-stoichiometric ribosome methylation by CfrV7 enables structural understanding of Cfr-mediated resistance to antibiotics.

(a) Cfr-modified 50S ribosomal subunit highlighting adenosine 2503 (A2503) within 23S rRNA and the binding site of PTC-targeting antibiotics. Cfr methylates A2503 at the C8 carbon to produce m2m8A2503. (b) Cryo-EM density maps of adenosine 2503 in 23S rRNA contoured to 3σ. Cfr-modified (m2m8A2503) in cyan. Wild-type (m2A2503) in orange; PDB 6PJ6. (c) Close-up view of 23S rRNA nucleotides in the 50S ribosomal subunit. Cfr-modified Escherichia coli ribosome in cyan. Wild-type E. coli ribosome in orange; PDB 6PJ6. (d) Structural overlay of Cfr-modified E. coli ribosome (cyan) and Haloarcula marismortui 50S ribosome in complex with pleuromutilin antibiotic tiamulin (purple, PDB 3G4S) highlighting steric clashes between m8A2503 and the antibiotic. EM, electron microscopy.

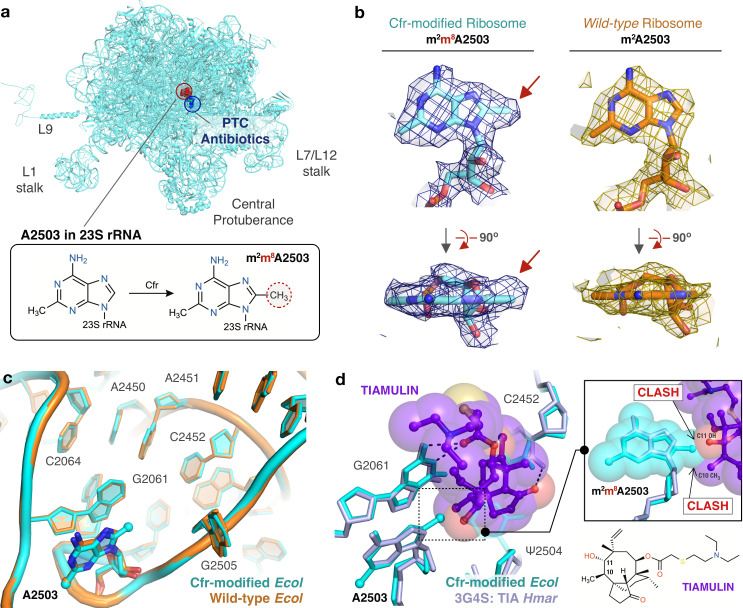
Figure 5.

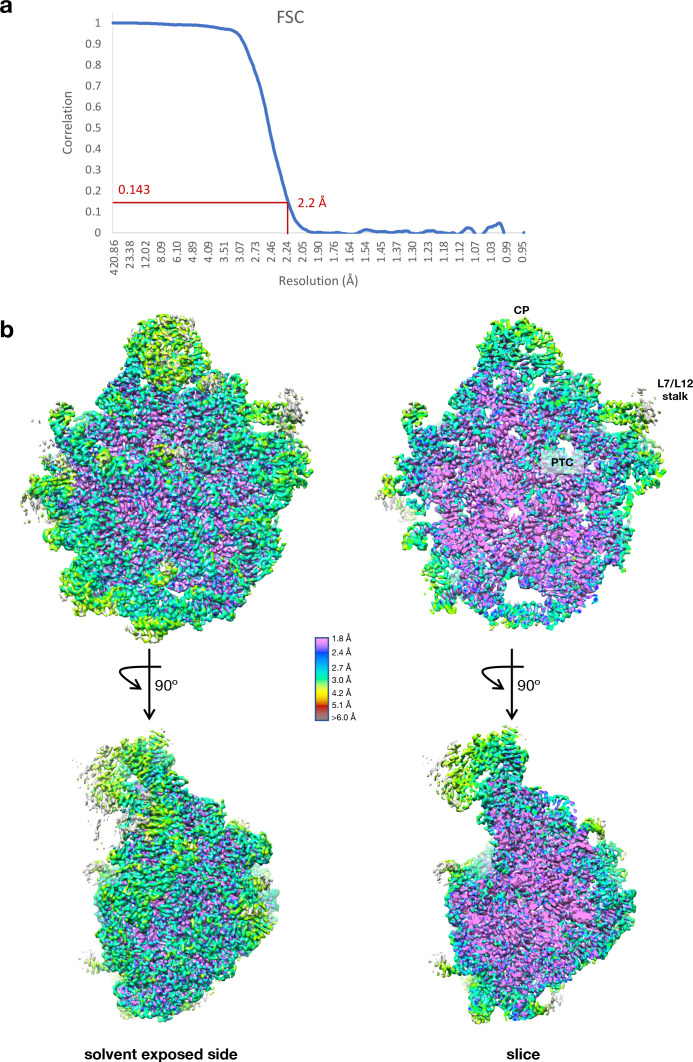
Figure 5—figure supplement 1. Cryo-EM data collection and processing of the Cfr-modified ribosome.

Figure 5—figure supplement 1.

(a) Fourier shell correlation (FSC) curve indicating the overall resolution of the Escherichia coli 50S subunit using the FSC=0.143 gold standard. (b) 3D cryo-EM map of the E. coli 50S subunit colored according to local resolution, highlighting the L7/L12 stalk and peptidyl transferase center (PTC). Local resolution map was calculated with ResMap. Figure was prepared using UCSF Chimera 1.13 (Pettersen et al., 2004). EM, electron microscopy.
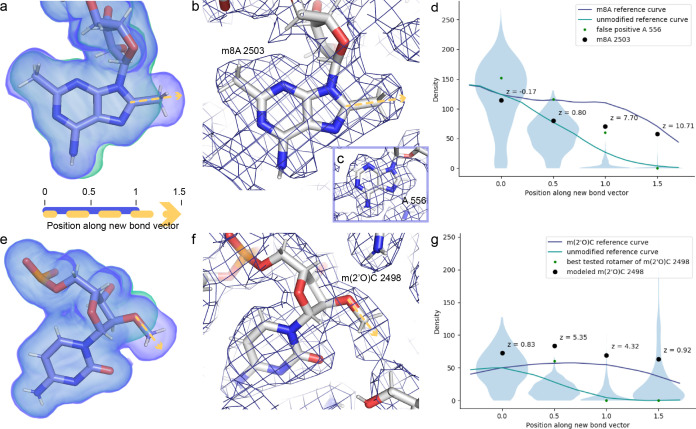
Figure 5—figure supplement 2. Cross-validation of methylations on C8 of A2503 and 2′O of C2498 from the cryo-EM density map.

Figure 5—figure supplement 2.

Ideal, noise-free densities were calculated for the post-transcriptionally modified (purple) and unmodified (green) nucleotides (a, e). We can distinguish which of these maps better matches the experimental map by examining the dropoff in density when moving from the reference atom (C8 or 2′O) toward and beyond the methyl group. To this end, the noise-free calculated densities were used to generate reference curves for these two modifications (d, g). These curves were scaled to match the mean density at the reference atom for all instances of adenosines (d) or cytosines (g) in the experimental structure, and for those same nucleotides, densities at four selected positions along the vector are also shown in violin plots (d, g). Based on these four densities as well as calculated difference density at the 1.0 position and the correlation coefficient between the calculated and experimental map for the entire nucleotide, the program qPTxM for detection of posttranscriptional modifications identified two adenosines where the map supported C8 methylation: A2503 and a false positive A556 (b–d). Investigation of the densities at these two sites confirmed that the shape of the density dropoff curve for A2503 more closely matched the methylated reference curve while that of A556 more closely matched the unmethylated reference curve, and that the latter site was identified as a strong candidate primarily due to the strong density at all atoms. qPTxM identified no cytosines where the map supported 2′O methylation (g). The densities along the methylation bond vector more closely match the unmodified than the methylated reference curve at C2498 (f) when the methyl group is placed at any of the rotameric positions (green dots), but along the modeled O-Me bond (black dots), the dropoff closely matches the shape of the methylated reference curve (g). Plots are annotated with Z-scores for the A2503 and C2498 densities relative to all adenosines and cytosines in the map. EM, electron microscopy.
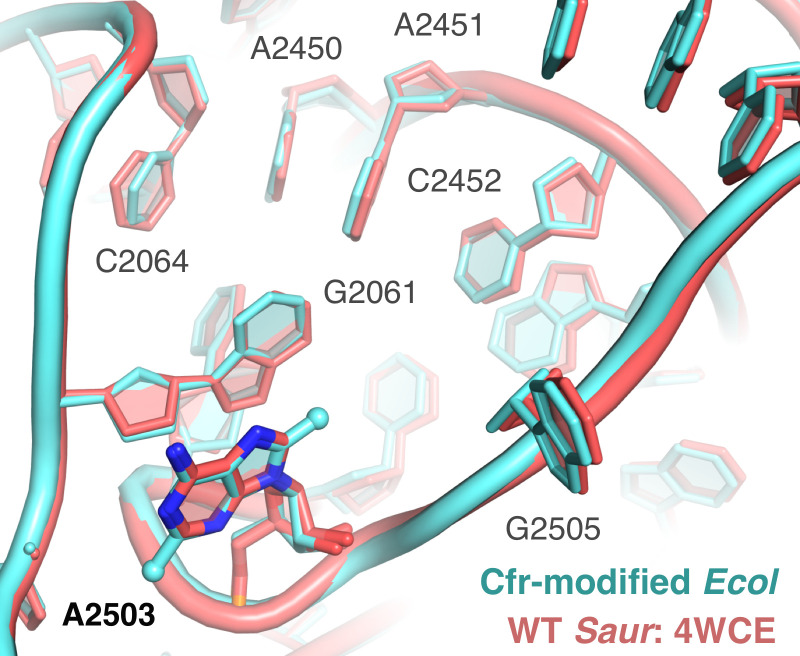
Figure 5—figure supplement 3. Overlay of Cfr-modified Escherichia coli ribosome and WT Staphylococcus aureus ribosome.

Figure 5—figure supplement 3.

Close-up view of 23S rRNA nucleotides in the 50S ribosomal subunit, highlighting the PTC region. Cfr-modified ribosome in cyan. Wild-type S. aureus ribosome in salmon; PDB 4WCE. PTC, peptidyl transferase center.
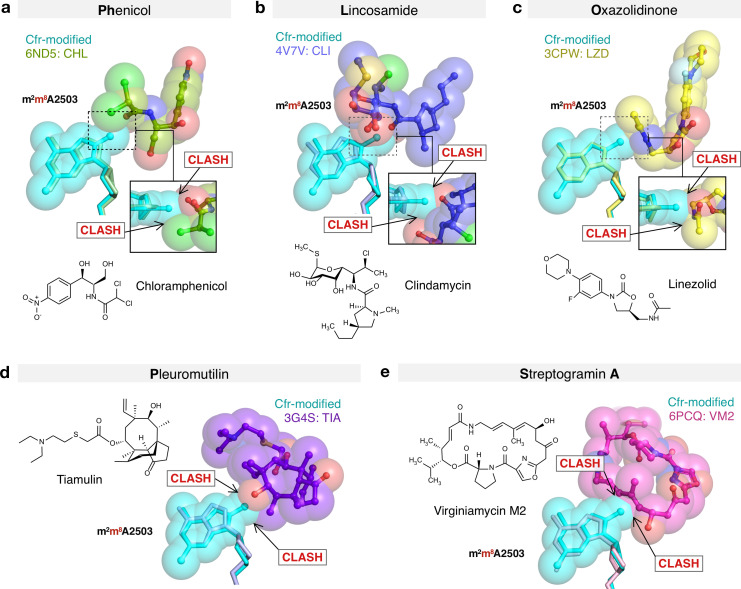
Figure 5—figure supplement 4. Molecular basis of Cfr-mediated resistance to PhLOPSA antibiotics.

Figure 5—figure supplement 4.

Structural overlay of Cfr-modified Escherichia coli 50S ribosome (cyan) and ribosomes in complex with (a) chloramphenicol (CHL); PDB 6ND5, (b) clindamycin (CLI); PDB 4V7V, (c) linezolid (LZD); PDB 3CPW, (d) tiamulin (TIA) PDB 3G4S, and (e) virginiamycin M2 (VM2); PDB 6PCQ. Inserts are close-up views of the steric clashes between m8A2503 and corresponding PTC-targeting antibiotics. PTC, peptidyl transferase center.
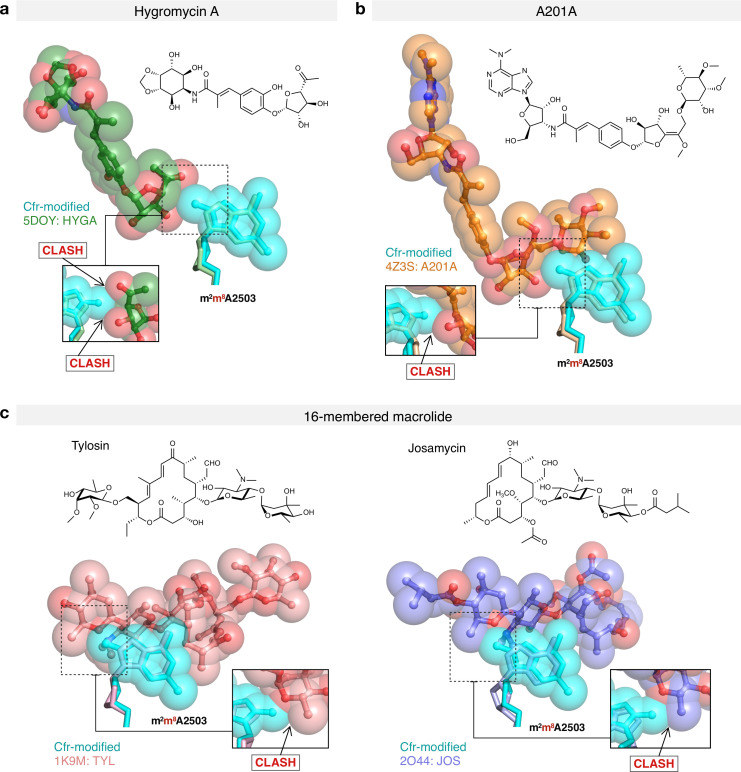
Figure 5—figure supplement 5. Molecular basis of Cfr-mediated resistance to hygromycin A, A201A, and 16-membered macrolide antibiotics.

Figure 5—figure supplement 5.

Structural overlay of Cfr-modified Escherichia coli 50S ribosome (cyan) and ribosomes in complex with (a) hygromycin A (HYGA); PDB 5DOY, (b) nucleoside analog A201A; PDB 4Z3S, (c) 16-membered macrolides tylosin (TYL); PDB 1K9M and josamycin (JOS); PDB 2O44. Inserts are close-up views of the steric clashes between m8A2503 and corresponding PTC-targeting antibiotics. PTC, peptidyl transferase center.