
FIGURE 2.
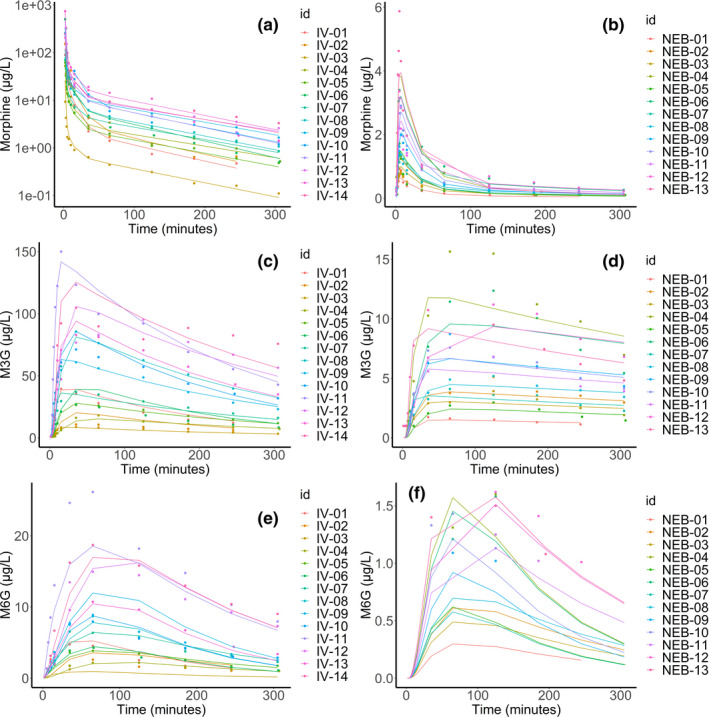
Individual predictions of morphine (upper panels, a, b), morphine‐3‐glucuronide (M3G; middle panels, c, d) and morphine‐6‐glucuronide (M6G; lower panels, e, f) following intravenous (left panels, a, c, e) and nebulized (right panels, b, d, f) administration. IV, intravenous; NEB, nebulized