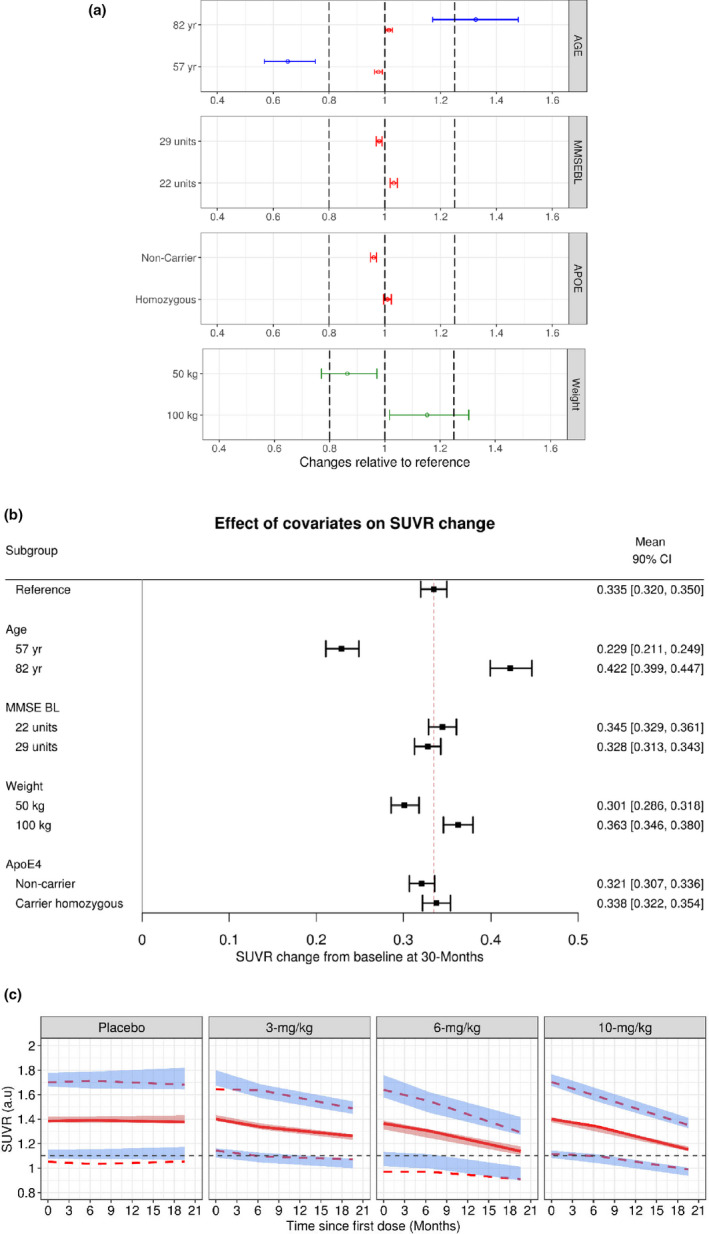
FIGURE 3.

Aducanumab population PopPK‐PD model evaluation. (a) Clinical relevance of statistically significant covariates; effects on PK‐PD parameters are expressed relative to a reference patient (ApoE4 heterozygous, MMSEBL = 26, age = 71 years, and baseline body weight = 70.9 kg). Data are mean (90% CI). Dotted lines represent bioequivalence limits of 0.8 and 1.25. The blue lines represent Emax, red lines represent baseline, and the green lines represent K out parameters, respectively. (b) Impact of covariates on SUVR change; effects are expressed as ΔSUVR at 30 months relative to a reference patient (ApoE4 heterozygous, MMSEBL = 26, age = 71 years, and baseline body weight = 70.9 kg). Data are mean (90% CI). (c) Prediction‐corrected visual predictive check for the final PopPK‐PD model of aducanumab. Solid lines represent the observed median, while dotted lines represent the observed prediction intervals. Shaded bands are simulation‐based 95% prediction intervals for the median, 5th, and 95th percentiles. ApoE, apolipoprotein E; Emax, maximum fold change in the elimination of SUVR; K out, first‐order rate of elimination of SUVR; MMSEBL, Mini‐Mental State Examination score at baseline; PK‐PD, pharmacokinetic‐pharmacodynamic; SUVR, standard uptake value ratio
