FIGURE 4.

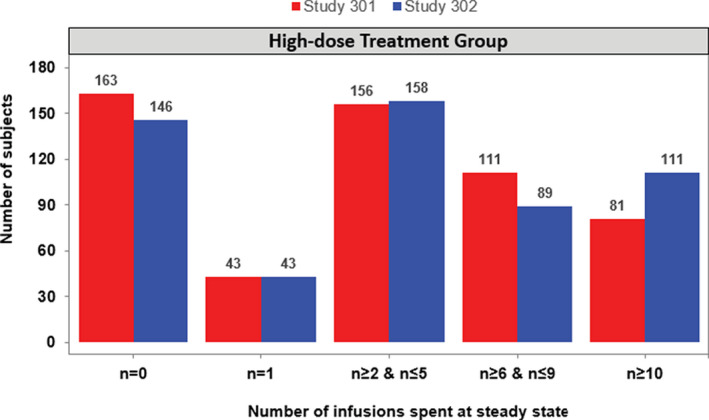
Bar plot of number of uninterrupted infusions spent at steady‐state in the high‐dose 10‐mg/kg treatment arms across studies 301 and 302

Bar plot of number of uninterrupted infusions spent at steady‐state in the high‐dose 10‐mg/kg treatment arms across studies 301 and 302