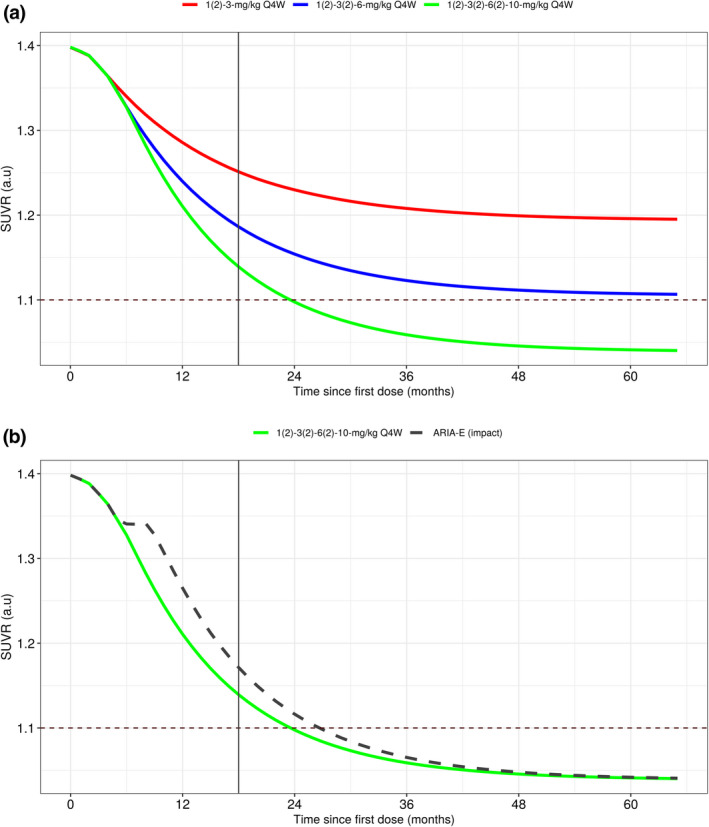
FIGURE 5.

Population mean simulations of nominal SUVR‐time profiles. (a) Exposure‐SUVR simulations illustrating dose response using the standard titration regimens evaluated in phase III studies. (b) Effect of dose interruption due to ARIA on the time profile of SUVR. ARIA, amyloid‐related imaging abnormalities; Q4W, every 4 weeks; SUVR, standard uptake value ratio
