. 2021 Dec 24;10:e50324. doi: 10.7554/eLife.50324

Figure 2. Frequency of MAITs cells in blood and intestine during HIV-1 infection.

(A) Representative dot-plot showing loss of CD8+ MAIT cells, gated on CD161++ and Vα7.2+, in CHI compared to HC. (B) Loss of MAIT cells in peripheral blood in HIV-1+ donors at different HIV-1 stages PHI, CHI, EC (Elite Controllers), and VC (Viraemic controllers). (C) No recovery of MAIT cells post-ART in CHI. (D) No recovery of MAIT cells post-ART in PHI. (E) No recovery of MAIT cells following long-term ART. (F) Higher percentage of MAIT cells in rectal and illeal tissue compared to blood in matched PHI-treated donors. (G) MAIT cell percentages in the rectum compared to terminal ileum of PHI-treated donors. Data points are biological replicates, shown as mean and standard deviation. Spearman’s correlation was used to calculate rho and p value. *p < 0.05, **p < 0.01, *** p < 0.001, **** p < 0.0001; two-tailed t-tests.

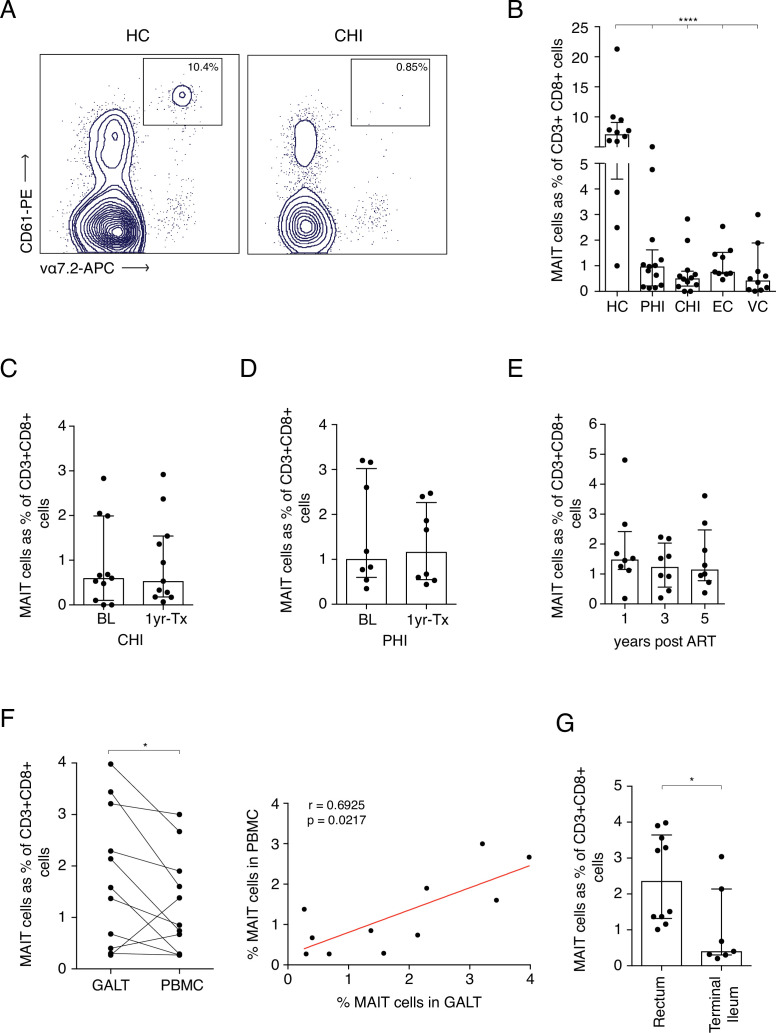
Figure 2—source data 1. Frequency of MAITs cells in blood and tissue during HIV-1 infection.
(B) MAIT cell frequencies in HC compared to PHI, CHI, EC, and VCs at baseline. (C) MAIT cell frequencies during CHI at baseline and 1 year post-ART. (D) MAIT cell frequencies during PHI at baseline and 1 year post-ART. (E) longitudinal MAIT cell frequencies during CHI at 1, 3, and 5 years post-ART. (F) Comparison of MAIT cell frequencies between GALT and PBMC. (G) Presence of MAIT cells in rectum and terminal ileum of PHI ART-treated subjects.

Figure 2.

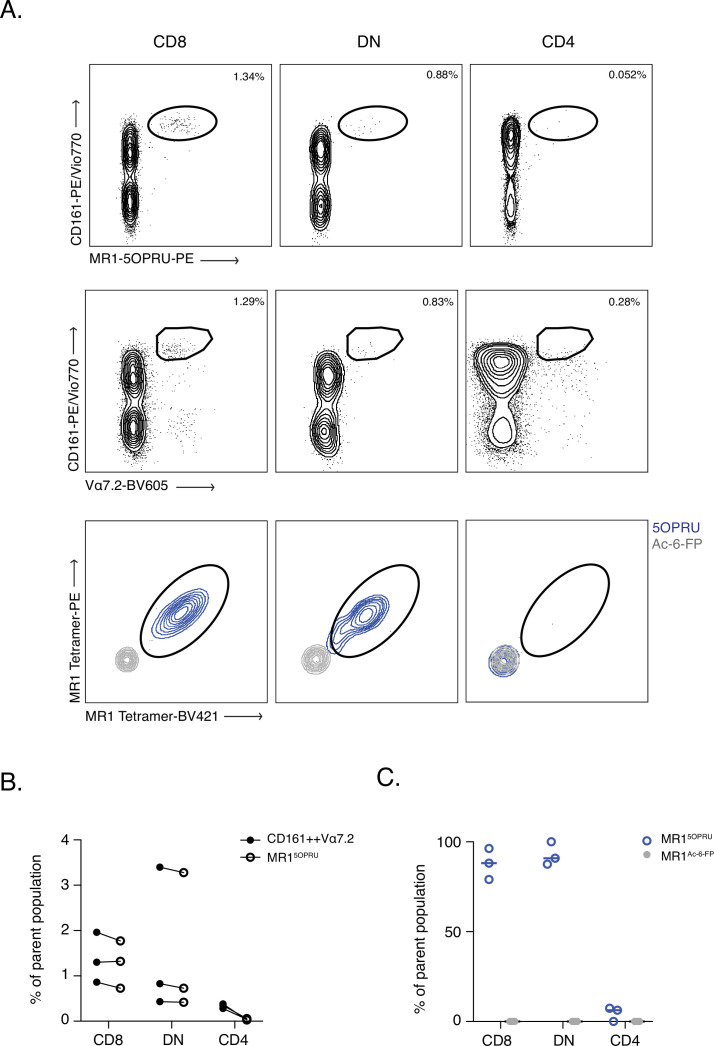
Figure 2—figure supplement 1. CD161++ Vα7.2+ identifies MAIT cells in tissue- comparable to MR1-5OPRU tetramers.

Figure 2—figure supplement 1.

(A) Representative dot plot of CD161 and Vα7.2 versus MR1-5OPRU tetramer staining in T cell compartments. (B) Comparison of MAIT cell percentages identified using the two staining methods. (C) Proportion of MR1-5OPRU and MR1-Ac-6-FP tetramer-bound cells within CD8+, DN, and CD4+ populations. Data points are biological replicates.